Variable renewables VRE in Japan exceeds 10%, and the reduction of dependence on fossil fuels is being hastened.
Summary
-
In 2021, renewables are estimated to account for 22.4% of all electricity generated in Japan (including on-site consumption), an increase of nearly 2 percentage points from 20.8% in the previous year.
-
In 2021, solar PV accounted for 9.3% of annual electricity generation, up about 1 percentage point from 8.5% the previous year, and variable renewables VRE (solar and wind) accounted for 10.2%.
-
The share of biomass power generation was 4.1%, up from 3.2% the previous year. On the other hand, wind and geothermal power generation remained almost unchanged from the previous year at 0.87% and 0.25%, respectively. Hydro power generation decreased slightly from the previous year to 7.8%.
-
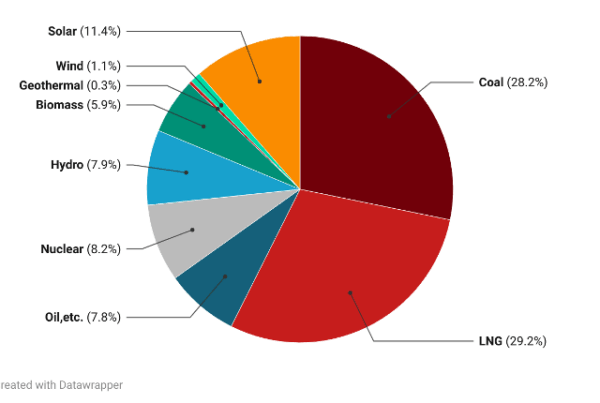
Fossil-fueled thermal power generation accounted for 71.7% of total electricity generated during the year, down from 74.9% the previous year. Coal and LNG accounted for 26.5% and 31.7%, respectively, and both fossil fuels are on a declining trend. Nuclear power accounted for 5.9%, up from 4.3% the previous year.
-
In Europe, the annual share of electricity generated from renewables will exceed 40% in 2021 in many countries, and the average for Europe as a whole (EU-27 + UK) will reach about 38%, almost the same level as the share of electricity generated from fossil fuels. Many countries, including Germany and the United Kingdom, exceed 20%, and the average for Europe as a whole is also about 20%.
-
In the electricity supply and demand data for 2021 in Japan, the share of renewables exceeded 30% of annual electricity demand in the areas of Hokkaido, Tohoku, Hokuriku, and Shikoku; there were time periods in which the one-hour maximum reached over 75% for Japan as a whole, with VRE exceeding 60% at the maximum value.1 There were time periods when the share of renewables in electricity demand exceeded 100% in the areas of Hokkaido, Tohoku, Hokuriku, Shikoku, and Chugoku at the maximum value of 1 hour.
Share of renewables to electricity generated in Japan
The percentage of total electricity generated in Japan are estimated including on-site consumption by power source in 2021 based on Electricity Survey Statistics[1] and nationwide electricity supply and demand data[2] . As a result, the share of renewables in Japan’s total electricity generation in 2021 was 22.4%, up approximately 2 percentage points from 20.8% in the previous year in Figure 1 and Table 1.
The share of renewables, which was about 12% in 2014, will have increased by more than one percentage point each year to reach more than 22% by 2021 in Figure 2. Among these, PV power generation accounted for 9.3%, up from 8.5% in the previous year, and is gradually approaching the share assumed in the power source composition for FY2030 by the Sixth Strategic Energy Plan approved by the Cabinet in October 2021. Combined with the 0.87% share of wind power, the share of VRE has exceeded 10%, reaching 10.2%, up from 9.4% in the previous year. As for renewables other than solar power, the share of electricity generated from biomass power was 4.1%, up from 3.2% in the previous year. On the other hand, wind power and geothermal power remained almost unchanged from the previous year at 0.87% and 0.25%, respectively. Hydroelectricity decreased slightly from the previous year to 7.8%.
By month, May 2021 had the highest share of electricity generated from renewables, reaching 31.1% in Figure 3. In May 2021 of that year, the share of hydropower was higher than usual at 12,7% due to the amount of water output, but in April the share of solar PV was higher at 13.0% and the share of VRE reached 14.0% compared to 14.5% in the previous year.
For wind power generation, data from electricity supply and demand data published by TSOs were used instead of data from electricity survey statistics which are amount of electricity transmitted and received by electric utilities. In addition, although data from the Electricity Survey and Statistics is used for the amount of electricity generated by PV power generation, it should be noted that the annual transmission volume is about 10% larger than the electricity supply and demand data, so there is a range of estimates for the proportion of PV power generation. Specifically, the annual amount of electricity generated by PV was 96.0 TWh in the electricity survey statistics, but 79.1 TWh in the amount of electricity transmitted based on electricity supply and demand data. Since the estimate for residential PV smaller than 10 kW is 3.4 TWh, the combined total is 82.5 TWh, which is about 10% smaller, and thus the share of PV power generation is 8.0%. The estimated amount of electricity generated from the Electricity Survey Statistics is the sum of the reported amount of electricity generated by electric utilities and the amount of electricity received from IPPs, so the figure may be larger due to double counting and other factors.
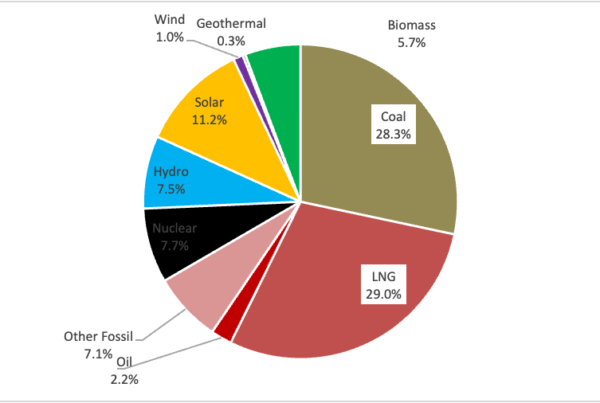
Thermal power generation is on a downward trend, accounting for 71.7% of electricity generated in 2021, down from 74.9% the previous year and down about 16 percentage points from 2014, but still at a high level. For coal-fired power, the share has decreased from 30.2% in 2016 to 26.5% in 2021, and for LNG there is a downward trend from 38.9% in 2016 to 31.7% in 2021. Nuclear power, on the other hand, after being reduced to zero in 2014, had been increasing its electricity production every year since 2015, but in 2020 it decreased from the previous year to 4.3%, but in 2021 it increased again to 5.9%.
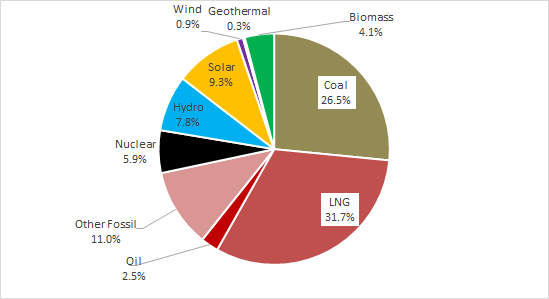 Figure 1: Source of power generation in Japan as preliminary data for 2021
Source: Compiled by ISEP based on electricity survey statistics, etc.
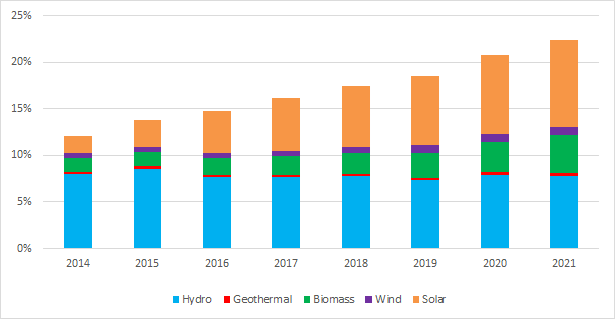 Figure 2: Share of Renewable Energy in Total Electricity Generated in Japan
Source: Compiled by ISEP from Electricity Survey Statistics, etc.
Table 1: Renewable Energy as a Percentage of Total Electricity Generated in Japan
Source: estimated by ISEP from Power Supply Survey Statistics, etc.
| Source | 2014 | 2015 | 2016 | 2017 | 2018 | 2019 | 2020 | 2021 | notes |
| Hrdro | 8.0% | 8.6% | 7.6% | 7.6% | 7.8% | 7.4% | 7.9% | 7.8% | Including large hydro power |
| Biomass | 1.5% | 1.5% | 1.9% | 2.0% | 2.2% | 2.7% | 3.2% | 4.1% | Including self-consumption |
| Geothermal | 0.24% | 0.25% | 0.22% | 0.21% | 0.22% | 0.24% | 0.25% | 0.25% | |
| Wind | 0.47% | 0.50% | 0.54% | 0.61% | 0.69% | 0.76% | 0.86% | 0.87% | TSOs data |
| PV | 1.9% | 3.0% | 4.4% | 5.7% | 6.5% | 7.4% | 8.5% | 9.3% | Including self-consumption |
| Renewable Energy | 12.1% | 13.8% | 14.7% | 16.4% | 17.4% | 18.5% | 20.8% | 22.4% | |
| VRE | 2.3% | 3.5% | 5.0% | 6.3% | 7.2% | 8.2% | 9.4% | 10.2% | |
| Fossil Thermal | 87.9% | 85.7% | 83.6% | 80.8% | 77.9% | 75.0% | 74.9% | 71.7% | Coal, LNG, Oil |
| Coal | 30.2% | 30.2% | 28.2% | 27.8% | 27.6% | 26.5% | |||
| LNG | 38.9% | 38.4% | 37.4% | 36.0% | 35.4% | 31.7% | |||
| Nuclear | 0.0% | 0.4% | 1.7% | 2.8% | 4.7% | 6.5% | 4.3% | 5.9% |
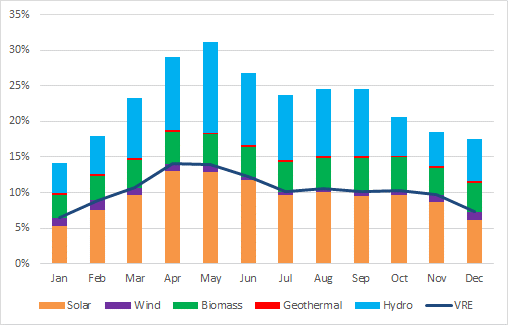 Figure 3: Monthly share of renewables in total electricity generated in Japan as preliminary data of 2021
Source: Compiled by ISEP from Electricity Survey Statistics, etc.
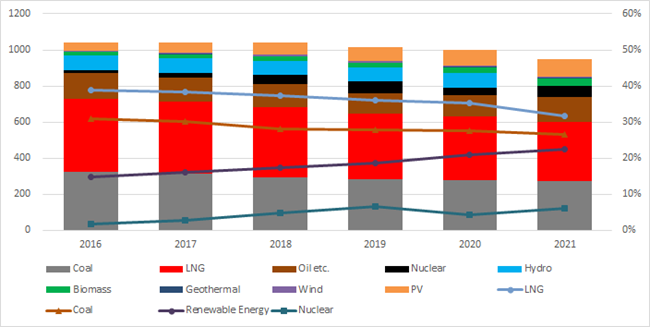 Figure 4: Annual Electricity Generation and Power Source in Japan
Source: Compiled by ISEP from Electricity Survey Statistics, etc.
Comparison of the share of renewable energy with other foreign countries
In terms of the introduction of renewable energy in the electricity sector, the European Union (EU) has been leading the world since the 1990s, and the share of electricity generated in all 28 European countries including the UK exceeded 30% in 2017 and will reach about 38% in 2021, almost equal to the share of electricity generated from fossil fuels. The number of companies that have been affected by the earthquake and tsunami in Japan has been increasing. This is nearly twice the share of renewables electricity in Japan. The share of VRE has also reached about 20% in Europe as a whole, double the share in Japan, which is about 10%.
Comparison of the share of annual electricity generation from renewable sources in 2021 for major European countries is shown in Figure 5. This figure is based on the latest data for 2021 on the electricity sector in European countries, as estimated by the British think tank Ember[3] . In Austria, there is a 60% share of hydroelectricity, which together with 10% wind power and 6% biomass, makes the share of renewables nearly 80%. In Denmark, where the share of VRE has already reached 53%, the share of renewables in annual electricity production is about 74%. The share of renewables has already reached 67% in Sweden, 62% in Portugal, and 40% in Spain (46%), Italy (41%), Germany (40%), and the UK (40%), exceeding the average for Europe as a whole. In Spain, the figure reaches 33%, and in Germany and the United Kingdom it is nearly 30%. On the other hand, in France, where the share of nuclear power plants reaches nearly 70%, the share of renewables is 22%, the same level as in Japan, and the VRE share is 9%.
The European Climate Law was approved by the European Parliament in June 2021, which aims for ambitious greenhouse gas emission reduction targets in order to achieve the Green Deal initiative for climate neutrality and green recovery in 2050.[4] In it, the reduction target for 2030 was significantly raised from 40% to 55%. The EU’s Renewable Energy Directive RED III is being reviewed along with the development of a new policy package to achieve the 55% reduction. The NECPs (National Energy and Climate Plans) are already in place, but they will need to be topped up as emission reduction targets are raised. Furthermore, with Russia’s military advance into Ukraine, Europe’s dependence on Russian natural gas and other energy sources is becoming a reality, and the need for an immediate energy transition is pressing. The goal is to reach an even higher target for 2030.
A comparison of the share of renewables in annual electricity generation in European countries and Japan from the 1990s to 2020 shows that European countries have steadily increased the share of renewables since the 1990s toward 2020 in Figure 6. However, for last year, 2021, some countries are affected by a temporary decrease in the share of wind power generation due to wind conditions.
In Denmark, the share was already 17% in 2000, exceeded 30% in 2010, reached 74% in 2021, and aims to exceed 100% renewables electricity by 2030.[5] In Denmark, 20 years of experience since 2000 in the power system has resulted in integrated solutions to provide more than 50% of electricity from variable renewables VRE from wind and solar in the power system and power market.
In Germany, the share was about 7% in 2000, then increased to nearly 20% in 2010 and reached 45% in 2020, but decreased to about 40% in 2021 due to the effect of reduced wind power generation due to wind conditions (Figure 7). However, due to the Ukrainian crisis, the new EEG bill (Renewable Energy Law) of 2022 aims for more than 80% renewable electricity in 2030 and 100% in 2035, in order to break away from dependence on natural gas from Russia. Germany has increased its share from only 6% in 2000 to 41% in 2021, a seven-fold increase.[6] Meanwhile, the share of nuclear power has declined from 29% to 12%, a steady decline toward 2022, when the country will be nuclear-free. The share of coal, including lignite, produced in Germany, which accounted for 50% in 2000, declined to 23.4% in 2020, mainly due to higher carbon prices in emissions trading (EU ETS), but increased to 28% in 2021 due to declining wind power and soaring natural gas prices. This is the same level as the combined wind and solar VRE share of 28.8%.
In China, in addition to hydropower, wind and solar power have been rapidly introduced over the past decade, and by 2021, wind power and solar power will account for 7.8% and 3.9% of annual electricity generation, respectively, and the VRE share has already reached 11.7%.[7] The share of renewables, including hydropower, in total electricity generated will reach 27.7%.[8]
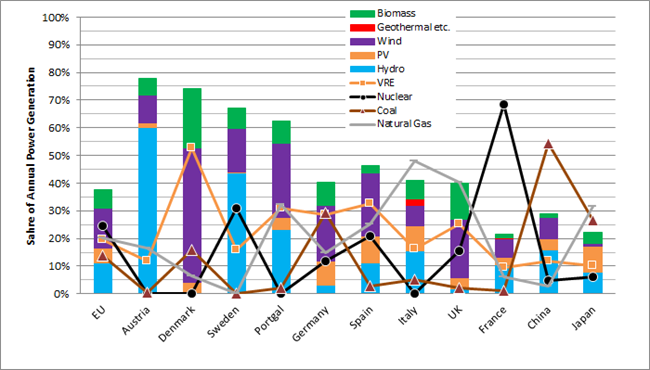 Figure 5: Comparison of share of renewables and other energy sources in electricity generation in European countries and China/Japan (2021)
Source: ISEP, based on data from Ember, China Energy Potal, Electricity Survey Statistics, etc.
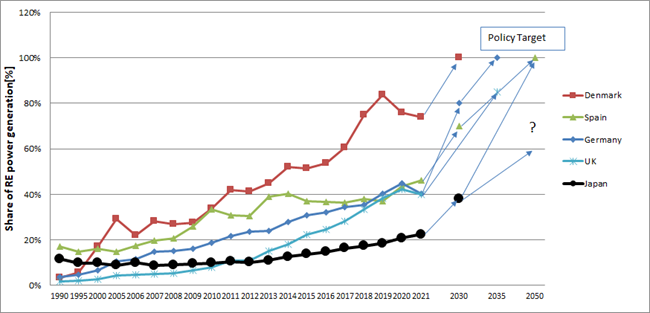 Figure 6: Renewable Electricity Installation Results and Targets in European Countries and Japan
(Source: Compiled by ISEP from EU Statistics Directorate, Agora Energiewende data, etc.)
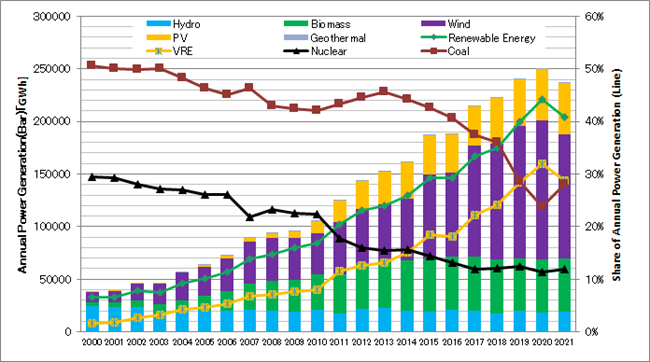 Figure 7: Amount of electricity generated from renewables in Germany and their share of total electricity generated
Source: Compiled by ISEP from AGEB data
Share of renewables in Japan’s domestic electricity supply and demand
The data is based on monthly electricity supply and demand data published by 10 general transmission and distribution companies for each area of Japan, and is compiled for the year 2021, focusing on the share of renewable energy to grid electricity demand. ISEP’s Energy Chart provides an interactive and easy-to-understand analysis of electricity supply and demand data in Japan using a variety of graphs from publicly available data. [9]
The share of renewables in Japan’s total annual electricity demand averaged 20.2% in calendar year 2021, up 1 percentage point from the annual average of 19.1% in calendar year 2020. The share of solar PV was 9.0%, which together with the 1.0% share of wind power, brought the share of variable renewables VRE to 10.1%. The share of solar PV increased from 8.1% the previous year and is larger than the 8.3% share of hydropower. Biomass power remained unchanged from 1.6% the previous year. By way of comparison, in FY 2016, renewables accounted for 13.8% of the total, with solar power at around 4.4%. Meanwhile, the share of nuclear power in 2021 was 7.0%, up from 5.0% the previous year, but smaller than the 7.4% share in 2019.
The monthly average of the share of renewables in Japan’s total electricity demand was highest in May 2021, at 28.6%, up from 27.5% the previous year in Figure 8. Within this category, VRE accounted for the largest share in April 2021, at 14.1%, up from 13.7% the previous year. The daily average reached 39.0% on May 30, 2020, while the maximum for VRE was 21.7% on May 3, 2021, up from the previous year’s maximum of 20.1%. At its peak for the year, solar reached 58.9%, and together with the 1.8% of wind power, the peak value of VRE was 60.7%. This is an increase from the previous year’s peak of 56.4% for solar PV. Incidentally, the peak value for wind power was 3.8% before dawn on October 7, 2021.
By electric power utilities, TSOs, area, the Hokuriku area had the highest average share of renewables in annual electricity demand in 2021 at 35.6%, but solar power and wind power accounted for the largest shares at 4.7% and 0.9%, respectively, while hydro power accounted for 28.2% in Figure 9. Even in the Tohoku area, which has the second largest share of renewables, the share will reach 35.1% by 2021, with solar power increasing to 10.4% from 9.0% the previous year. The share of wind power also increased to 4.4% from 4.3% the previous year, bringing the VRE share to 14.7%, making the VRE share of wind power as high as that of the Hokkaido area among all areas in Japan. The Tohoku area also has the highest share of biomass power generation in Japan at 4.0%, and the geothermal power generation share of 1.3% is the highest in the country, along with the Kyushu Electric Power area.
In 2021, the average share of renewables in eastern Japan as a whole is 19.4%, lower than the national average of 20.2%. This is largely due to the fact that the Tokyo Electric Power Company(TEPCO) area accounts for only 13.6%. In the TEPCO area, solar PV power accounted for 7.6%, higher than the 4.8% share for hydroelectric power. In the Hokkaido area, the share of renewables was 30.0%, but the VRE share reached 13.3% with a high share of wind power (4.4%) compared to solar power (8.9%).
In 2021, the overall share of renewables in Central and Western Japan was 20.9%, higher than the national average of 20.2%, but with a higher share of VRE (10.3%), including 9.6% solar and 0.6% wind. On the other hand, nuclear power plants, which have zero operations in eastern Japan and in the Kansai and Kyushu areas in central and western Japan, accounted for 12.8%, higher than solar, but up from 9.1% the previous year. In Shikoku area, the third largest share of renewable energy, the share was 30.8%, unchanged from the previous year’s 30.8%, but the share of nuclear power plants was 1.8%, up from zero the previous year. The percentage of VRE, which includes 14.2% solar and 1.8% wind, reached the highest level in Japan at 16.0%, up from 15.1% the previous year. In the Kyushu area, where the share of solar power was 14.6%, the highest level in Japan, the share of renewable energy was 25.8%, down from 26.3% the previous year. In particular, in the Kyushu area, solar power reached 14.6% compared to 5.0% for hydropower, and together with 1.0% for wind power, the share of VRE was 15.6%, the second highest level in the country after the Shikoku area.
In 2021, five areas in Hokkaido, Tohoku, Hokuriku, Shikoku, and China had more than 100% renewables in the 1-hour value. The previous year, in 2020, the three areas were Shikoku, Tohoku, and Kyushu. In particular, in the Shikoku area, the share of renewables to electricity demand reached 121.9% at 11:00 a.m. on May 23, 2021. At this peak, solar and wind power accounted for 90.6% and 0.4%, respectively, and VRE accounted for 91.0%. Furthermore, on May 3, the percentage of solar reached 101.3% at 11:00 and 12:00, and together with 0.9% of wind, the percentage of VRE reached 102.2% (Figure 10). In the Tohoku area, the share of renewables reached a maximum of 121.2% at the peak hourly value (11:00 a.m. on May 4, 2020). At this time, solar and wind power accounted for 75.9% and 11.5%, respectively, and the VRE share reached 87.4%. In the Tohoku area, wind power generation peaked at 17.2% of the hourly value (April 19, 2021 at 0:00 a.m.); in the Chugoku area, where the percentage of renewables in the hourly generation exceeded 100% of electricity demand for the first time in 2021, it reached 107.3% at 11:00 a.m. on May 3, 2021, with solar 90.2%, wind 1.5%, and VRE 91.8%. For the first time, the peak hourly generation in the Hokkaido and Hokuriku areas also exceeded 100%, reaching 102.5% and 100.3%, respectively. In Hokkaido, 58.3% solar, 6.6% wind, and 35.3% hydro reached 64.9% VRE at 10:00 on June 6, 2021. In the Hokuriku area, the VRE was relatively low at 44.0% with solar at 42.7%, wind at 1.4%, and hydro power at 54.5%.
In the Kyushu area, the maximum percentage of hourly generation for renewables in 2021 was only 90.7%, with a maximum of 81.8% for solar power and 5.1% for wind power. On the other hand, VRE curtailment was the only one implemented in the Kyushu area, with the VRE curtailment rate for the entire year at 4.4%, up from 3.8% in the previous year. In the Kyushu area, 10.74 GW of solar power generation had already been connected to the power grid under the FIT system as of the end of December 2021, and together with 630 MW of wind power generation, the VRE connected capacity exceeded 11 GW in Figure 11. In addition, about 4 GW of nuclear power generation is in operation at any given time, and the VRE output curtailment is also greatly affected by the operation of these nuclear power plants. It is increasingly likely that other areas will also experience VRE curtailment in the future. Although the rules for VRE curtailment have been reviewed and the use of online control of VRE has been progressing, the rules have become more complex and have not been optimized for the entire power system. Inter-regional interconnection lines are now being used effectively, and further improvement and enhancement of operations are required. The use of pumped hydro storage and storage batteries is effective, but further promotion and optimization of online control of VRE, review of minimum output of thermal power generation, DR (Demand Response), VPP (Virtual Power Plant), etc. are required.[10]
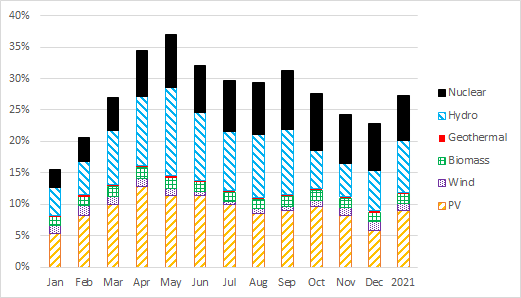 Figure 8: Share of renewables and nuclear power in Japan’s nationwide electricity supply and demand by month (2021)
Source: compiled from electricity supply and demand data of TSOs
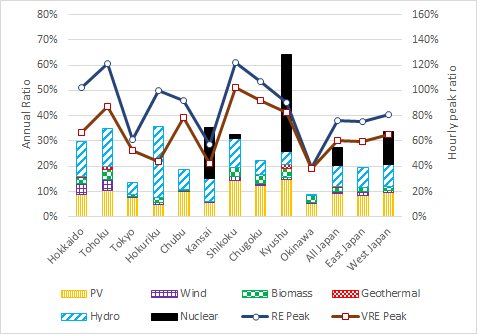 Figure 9: Share of renewables in electricity supply and demand by area (2021)
Source: compiled from electricity supply and demand data of TSOs
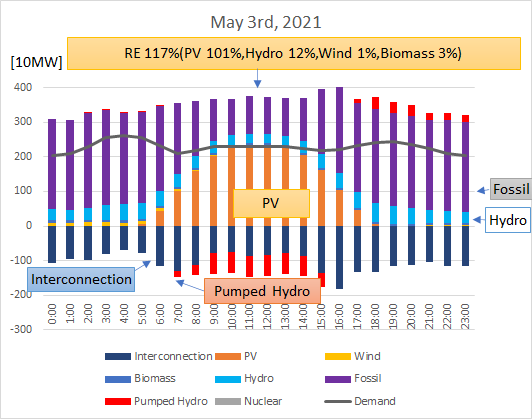 Figure 10: Electricity Supply and Demand in Shikoku area (May 3, 2021)
Source: Compiled from Shikoku Electric Power Company’s electricity supply and demand data
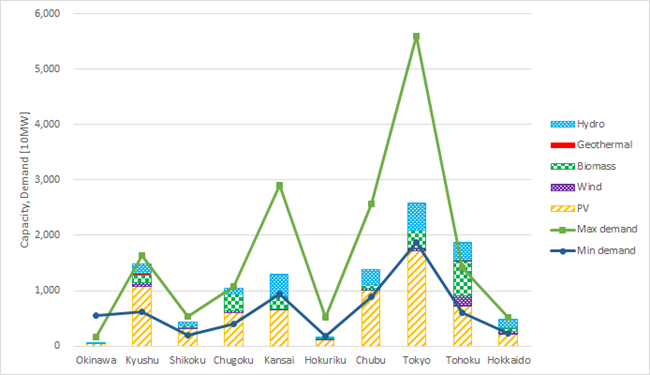 Figure 11: Grid connections in TSO areas (by end of December 2021)
Source: Compiled from data of general transmission and distribution companies
References
[1] METI, “Electricity Survey Statistics” http://www.enecho.meti.go.jp/statistics/electric_power/ep002/
[2] The estimates use the previous year’s values for the estimated on-site consumption of private power generation and residential PV after October 2021, but the impact is expected to be small.
[3] Ember “European Electricity Review 2022,” 2022, https://ember-climate.org/insights/research/european-electricity-review-2022/
[4] EU Commission “European Climate Law“ https://ec.europa.eu/clima/policies/eu-climate-action/law_en
[5] Danish Energy Agency, “The development of flexibility and its role in the Danish electricity system,” https://ens.dk/sites/ens.dk/files/Globalcooperation/development_and_role_of_flexibility_in_the_danish_power_system.pdf
[6] AGEB “STORMMIX 1990-2021” https://ag-energiebilanzen.de/
[7] China Energy Portal https://chinaenergyportal.org/en/
[8] Hironao Matsubara, “Global Renewable Energy Market Growth Continues Toward Decarbonization – Still Record in 2021,”(in Japanese) Energy Democracy, https://www.energy-democracy.jp/3748
[9] ISEP Energy Chart http://www.isep.or.jp/chart/en
[10] ISEP, “Response to Output Suppression of Solar and Wind Power in the Service Area of Kyushu Electric Power Company”(in Japanese) https://www.isep.or.jp/archives/library/13538