ISEP collected and summarized the data on renewable energy power in Japan. The preliminary report shows the share of electricity generated by renewable energy reaches 17.4%, the PV to 6.5%.
Summary
- It is estimated that the share of total renewable energy generation (including self-consumption) in Japan in 2018 (calendar year) has increased to 17.4% from 16.4% in the previous year.
- The share of solar PV power generation in Japan increased from 5.7% in the previous year to 6.5% in 2018, and the share of VRE (Variable Renewable Energy: Solar PV and wind power) increased to 7.2% from 6.3% in previous year.
- Wind power (0.7%) and Biomass (2.2%) also tend to increase in power generation, but hydropower and geothermal power continue to remain the same amount of power generation.
- In terms of the share of fossil fuel generated power, the percentage has decreased from 81% in the previous year to 78%, however, this level is still high, also the nuclear power generation has increased from 2.8% in the previous year to 4.7%.
- The share of renewable energy to the annual power demand in 2018 (calendar year) is 16.5% in the whole country, and Hokuriku Electric Power and Tohoku Electric Power are as high as about 30% by area.
- The share of VRE in the power supply and demand in 2018 is as high as about 12% for the area of Shikoku and Kyushu Electric Power, and Shikoku has a maximum of 1 hour in May 2018. With renewable energy exceeding 100% of demand, VRE output curtailment was implemented for the first time nationwide in October 2018 in Kyushu area.
- In many European countries, there are already many countries where the annual power generation share of renewable energy exceeds 30%, and in other countries, the share of VRE also exceeds 20%.
- Each European country has set a high medium- to long-term target for introducing renewable energy, and some countries aim to supply electricity with 100% renewable energy by 2030. Compared to these, Japan’s target 24% is very low.
Share of renewable energy to total domestic power generation
Based on power survey statistics [1], FITs, and power supply and demand data for the whole country, we estimated the share of all power generation (including self-consumption) in Japan in 2018 by power supply. However, the previous year’s figures are used to estimate the amount of home-use solar PV from October 2018. In addition, for wind power generation, the amount of power transmission by the FIT system is used (because it is considered that there are duplicates in the figures of the power survey data).
[1] Survey of Electric Power Statistics (Japanese Only)
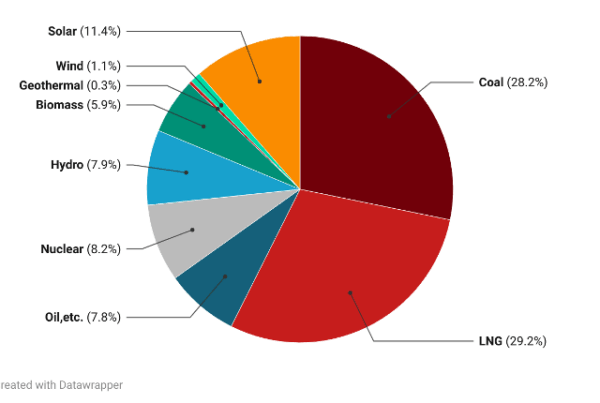
As a result, the share of total renewable energy generation in Japan in 2018 (calendar year) increased to approximately 17.4% from 16.4% in the previous year as shown in Table 1, and Figure 1. The proportion of renewable energy, which was about 12% in 2014, reached more than 17% with an increase of about one point each year (Figure 2). Among them, the amount of solar PV power generation has increased from 5.7% in the previous year (2017) to 6.5%, which is very close to the target value that the 5thBasic Energy Plan [2] by the government assumes in fiscal 2030. Together with the share of wind power 0.7%, the share of VRE has increased from 6.3% in the previous year (2017) to 7.2%.As for renewable energy sources other than solar PV, wind power and biomass power generation increased by about 10%, but hydropower and geothermal power remained the same percentage due to the relationship between the amount of water discharge and the amount of steam.
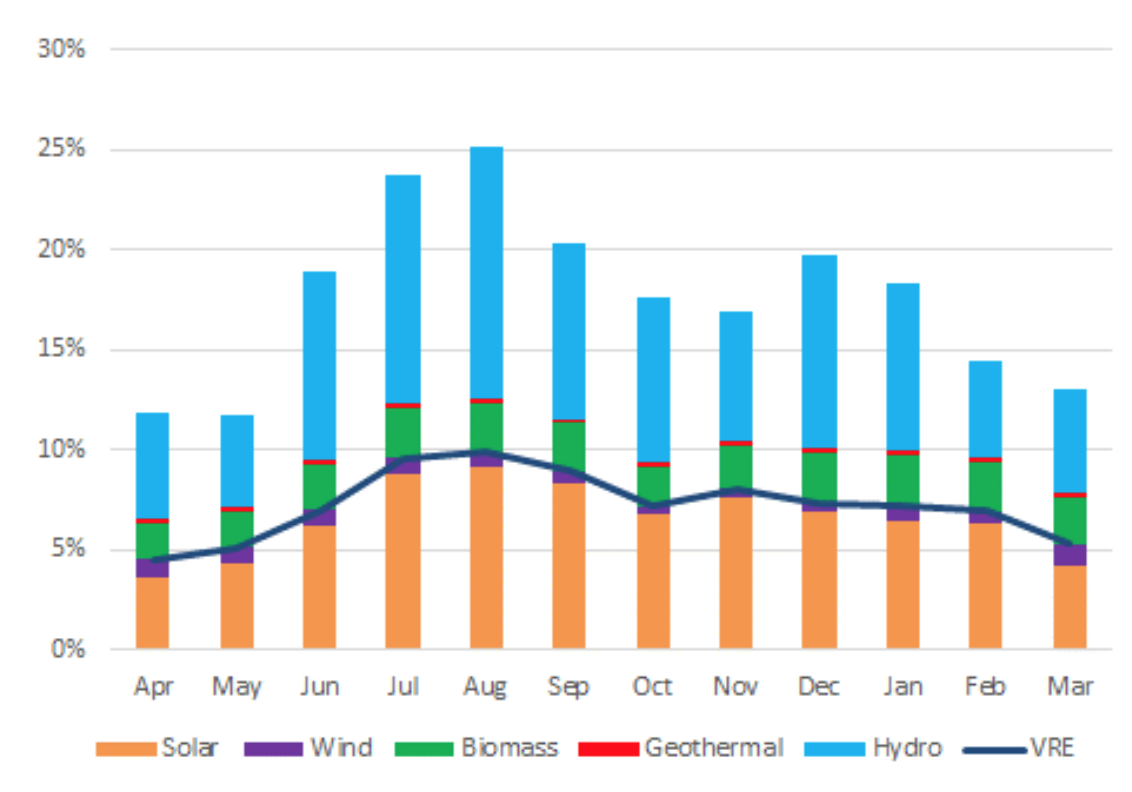
May has the highest percentage of renewable energy among the year, reaching about 25% (Figure 3). The share of hydropower is high at 12.5% because of the amount of water discharge, the percentage of solar PV is at 9.2%, and the share of Variable Renewable Energy (VRE) has reached about 10%.
Fossil Fuel power generation showed a declining trend, in comparison to the previous year, 2018 has decreased from 80.8% to 77.9%, and from the year 2014, the generation has decreased 10 points but it is still at a high level. On the other hand, nuclear power generation has reached 0% in 2014 but starting in 2015, the generation has been increasing every year, although the total amount of generation reached 4.7% in 2018, it is still has a lower generation level than the solar power generation (6.5%).
Table 1: Transition of the share of renewable energy to total power generation in Japan | Source: ISEP based on statistics of METI, etc.
| Source | 2014 | 2015 | 2016 | 2017 | 2018 | Notes |
| Hydro | 8.0% | 8.6% | 7.6% | 7.6% | 7.8% | Including large scale (>1MW) |
| Biomass | 1.5% | 1.5% | 1.9% | 2.0% | 2.2% | Including in-house power generation |
| Geothermal | 0.2% | 0.2% | 0.2% | 0.2% | 0.2% | |
| Wind | 0.5% | 0.5% | 0.5% | 0.6% | 0.7% | Electricity supply on grid |
| Solar | 1.9% | 3.0% | 4.4% | 5.7% | 6.5% | Including in-house power generation |
| Renewable Energy | 12.1% | 13.8% | 14.7% | 16.4% | 17.4% | |
| VRE | 2.3% | 3.5% | 5.0% | 6.3% | 7.2% | |
| Thermal (Fossil Fuel) |
87.9% | 85.7% | 83.6% | 80.8% | 77.9% | Coal, LNG, Oil, etc. |
| Nuclear | 0.0% | 0.4% | 1.7% | 2.8% | 4.7% |
Figure 1: Power supply mix of Japan (2018) | Source: ISEP based on data of METI
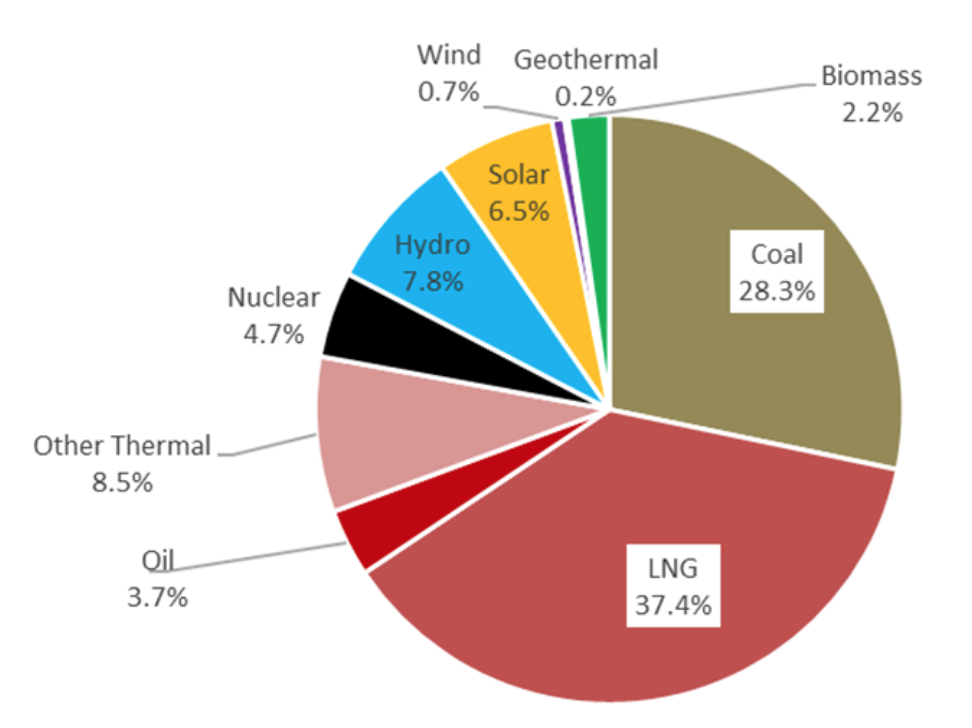 Figure 2: Trend of the share of renewable energy to the total power generation in Japan | Source: ISEP based on data of METI
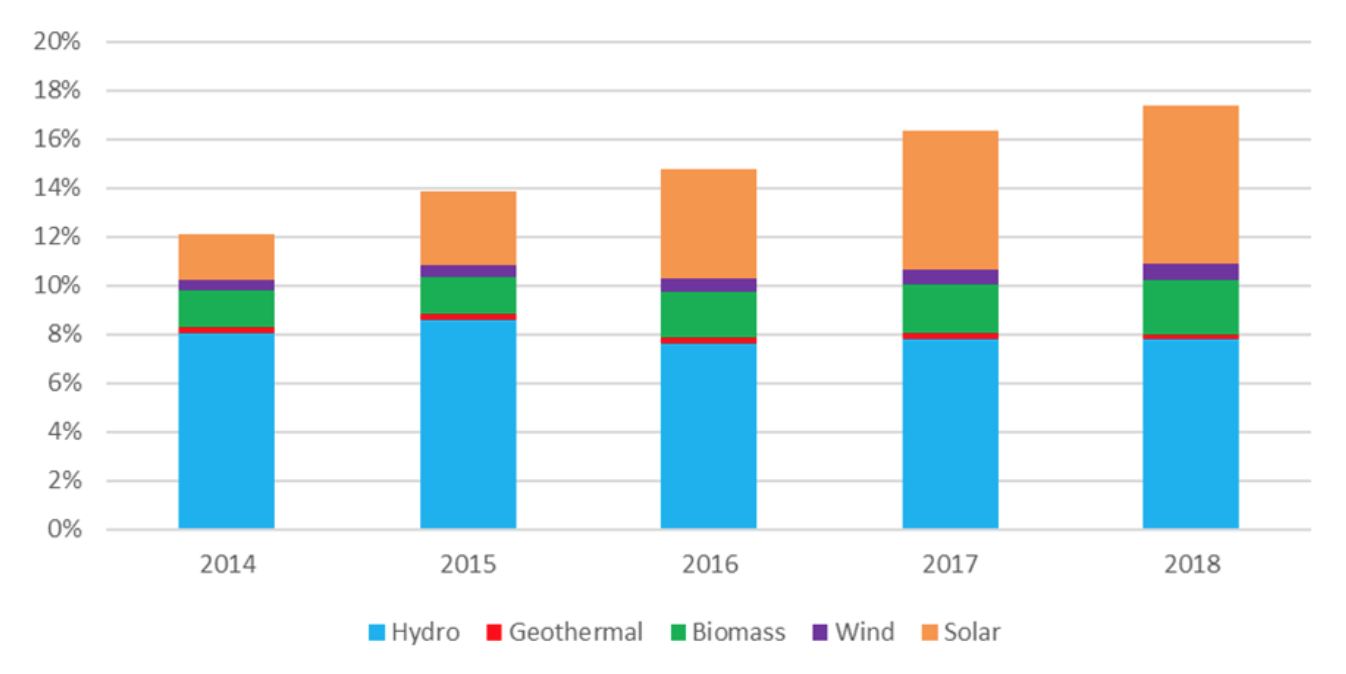 Figure 3. Monthly Share of Renewable Energy Power Generation in Japan (2018) | Source: ISEP based on data of METI
 Share of renewable energy to domestic power demand
From fiscal 2016, based on laws and regulations, general transmission and distribution 1 hour data of electricity supply and demand for 10 power utility company area have been disclosed by each TSO(Transmission System Operator) [3]. The supply and demand data that has been announced by TSOs every three months has been released monthly from October 2018. In Europe, where the power market is in place, there are already many web sites where TSO publishes data in near real time and visualizes the data in an easy-to-understand manner. In October 2018, the power curtailment of solar PV and wind power was carried out for the first time in the area in Kyushu. Japan is also required to disclose power supply and demand data as soon as possible. ISEP’s visualization site “ISEP Energy Chart” allows you to analyze data in an easy-to-understand manner on various graphs interactively from published data [4].
[3] OCCTO power grid information service (Japanese only)
Based on this power supply and demand data, the share of renewable energy to the power demand in Japan can be calculated from FY2016. As a result of tabulating in 2018 (calendar year), the average value in 2018 is 16.5% as shown in Figure 4. The average monthly share of renewable energy to electricity demand in May 2018 is the highest at 24.4%, but the daily average reached 34.1% on May 5th 2018. Furthermore, as shown in Figure. 5, the same 1 hour value is the highest at 62.0% from 11:00 to 12:00 on May 5th and the solar PV reaches 44.6% (hydro power 14.9%, wind power 1.7%, biomass 0.5% , Geothermal 0.3%).
By area of electric power utility (TSO company), 31.2% of the Hokuriku area was the highest share of renewable energy in the year of 2018, but hydro power is a large proportion with 27.8%. In the Tohoku area, the share of renewable energy was 29.4%. While the share of hydro power is high at 14.8% and solar PV is rising from 5.0% in previous year to 6.7%, the share of wind power is also relatively high at 3.0% in the Tohoku area.
Furthermore, in the Hokkaido area, the share of wind power is the highest in Japan, reaching 3.2%, as opposed to 4.6% of solar PV, while hydro power accounts for a large proportion of 16.7% (total renewable energy is 25.1 %). Although the share of renewable energy is 15.2% below the national average on average in East Japan as a whole, the fact that the Tokyo Electric Power Company (TEPCO) area remains at 10.0% is a major factor. In this TEPCO area, solar PV is characterized by 5.3%, which exceeds 4.2% of hydropower.
In South and Middle Japan, the share of renewable energy in the Shikoku area is the highest, reaching 24.7%, and it is 9.7% of Solar PV to 13.1% of hydro power. In South and Middle Japan as a whole, the share of renewable energy reaches 17.5%, which is higher than 15.2% of East Japan, and the share of VRE is also higher than 7.5% of East Japan, which is 6.6%. In the Shikoku area, renewable energy exceeded 100% of the electricity demand at the hourly value on May 20th (Sunday), 2018 [5].
[5] ISEP “Renewable energy has exceeded 100% of electricity consumption in Shikoku Area, Japan”
Figure 4: Share of renewable energy and nuclear power supply and demand by power company area (2018) | Source: ISEP from data of each power utility company
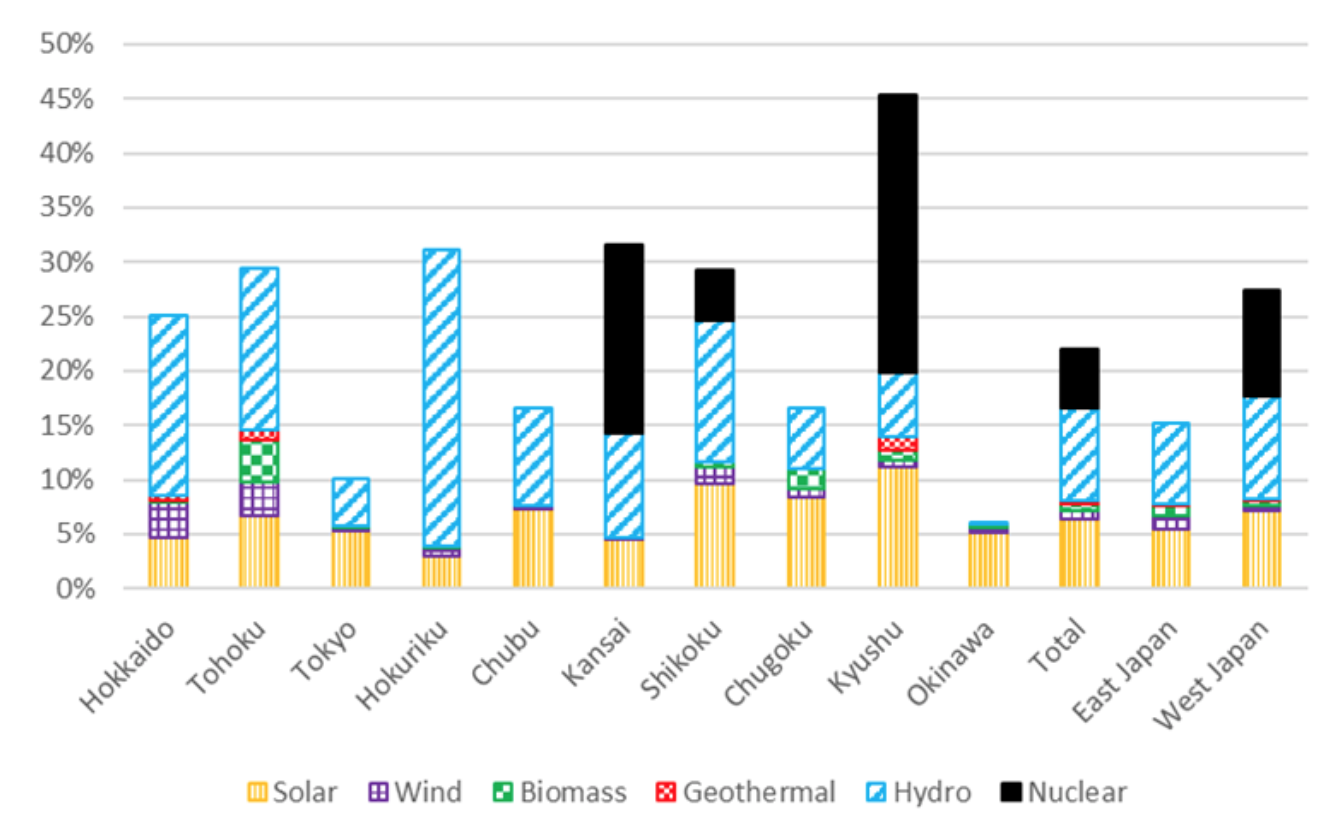 Figure. 5: Maximum value of renewable energy share of power supply and demand (1 hour value) by power utility company area (2018) | Source: ISEP from data of each power company
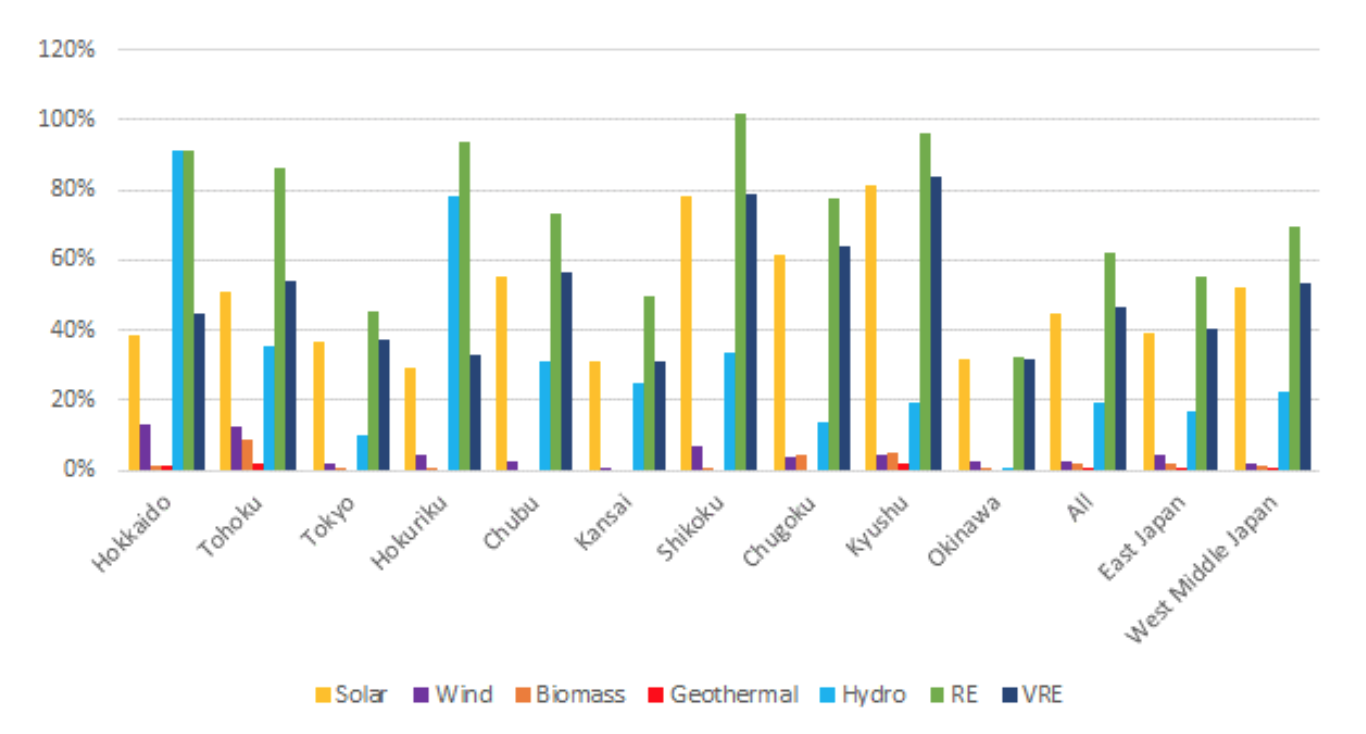 Kyushu Electric Power, which is the most advanced area in Japan for the penetration of solar power generation, saw the share of renewable energy to annual electric power demand increase to 19.9% in 2018, and that of solar power has reached 11.1%. While the share of VRE is also the highest in Japan at 11.8%, four nuclear power reactors, about 4GW output, already re-started last year, which cannot basically adjust their output.
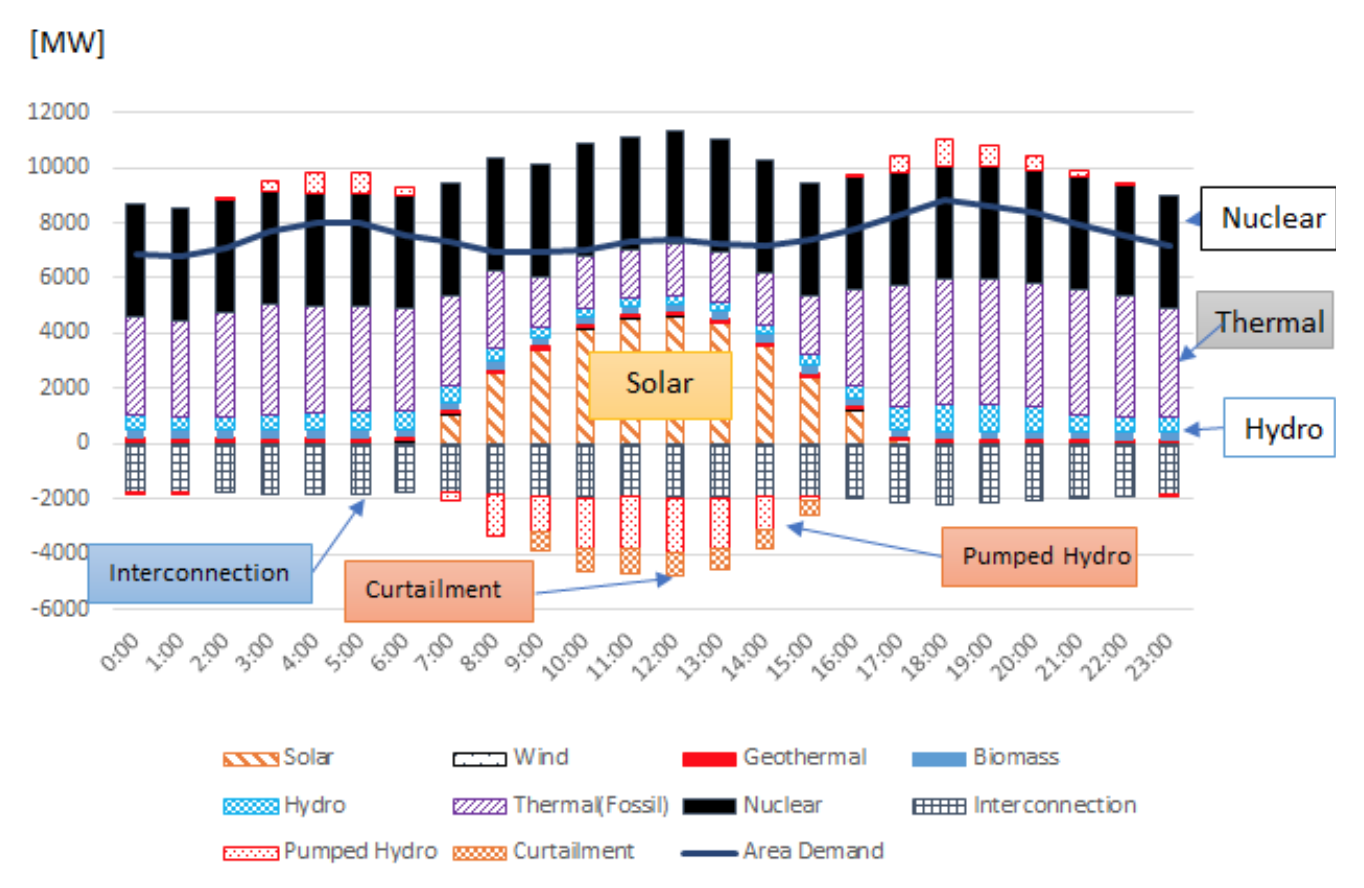
In Kyushu, the share of nuclear power to annual power demand has reached 25.5% in 2018. As a result, based on the current priority feeding rule, the power curtailment of solar power generation was carried out for the first time in Kyushu, Japan on October 13th, 2018 (Saturday).
On the other hand, in September 2018, ISEP proposed improvements to be made before curbing renewable energy output [6]. A total of eight time output curtailments were carried out during 2018, but on October 21 (Sunday), a maximum of 920 MW of power curtailment against solar PV was carried out, and the curtailment amount was one day by solar PV reached about 14% of the power generation as shown in Figure 6.
[6] ISEP “Six proposals: Kyushu Electric Power should do before solar PV curtailment” (Japanese Only)
Figure 6: Electricity supply and demand in the Kyushu Electric Power area (October 21, 2018) | Source: Data from Kyushu Electric Power
 Comparison of the share of renewable energy with European countries
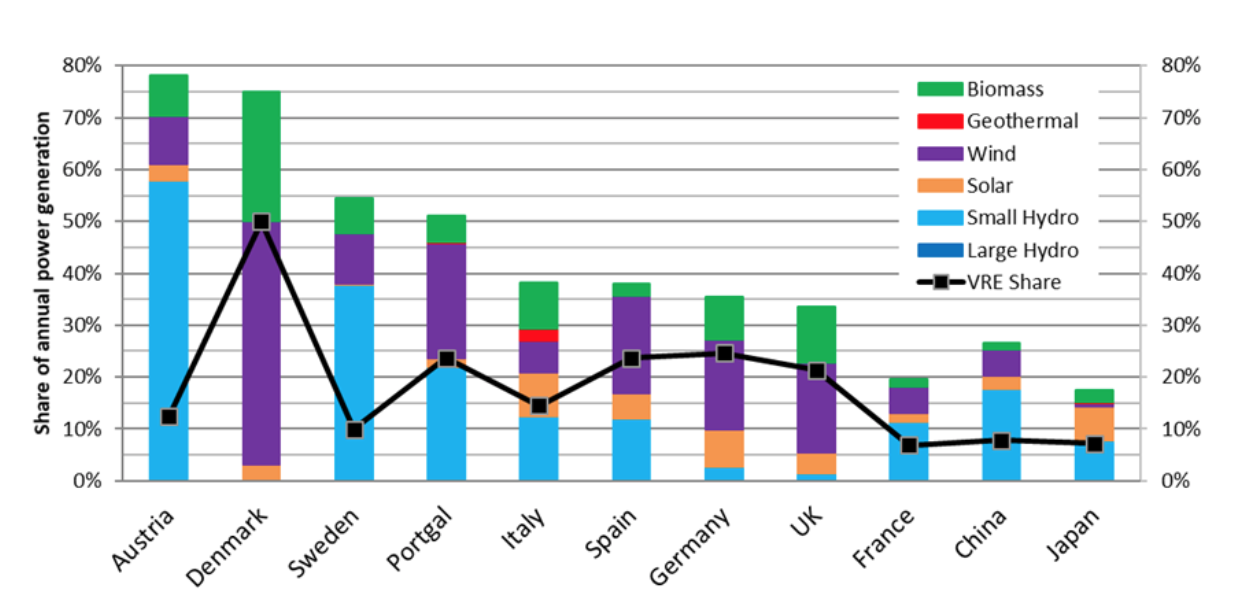
The share of renewable energy of power generation in 2018 was compared with European countries and China as shown in Figure 7. Many European countries have already supplied more than 30% of their annual energy production with renewable energy. The share of VRE is also over 20% in Germany, Spain, Portugal and the UK, with Denmark leading more than 50% while Japan still around 7%.
Figure 7: Comparison of the share of renewable energy to the power generation of European countries and China with Japan (2018) | Source: Data from Agora Energiewende, China Energy Potal, Power Survey Statistics, etc.
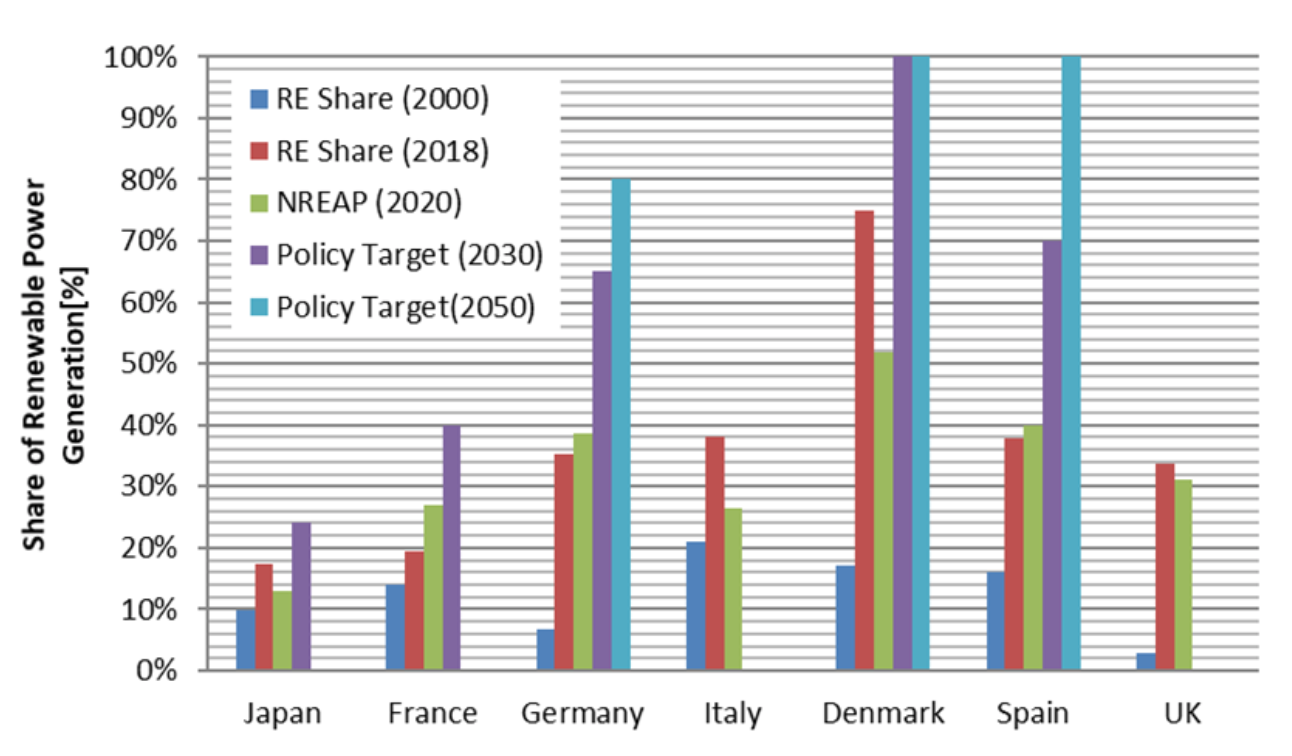
 With regard to the policy targets for renewable energy, European countries have set high share targets for 2020, 2030 and 2050, and are promoting various energy policies in each country. In Europe, the national target of renewable power in NREAP (National Renewable Energy Action Plan) has already reached many countries in 2020 as shown in Figure 8. As for the target of renewable energy in 2030, it is announced in Europe that the renewable energy share will be 32% or more against the final energy consumption, but with regard to renewable energy power, Denmark and Spain have already set 100% target in 2030. It has set a high goal of 65%. compared to these countries, Japan’s target of 24% in 2030 has reached 17%, and it can be said that it is a much lower target even considering that solar power has almost reached 7% of the target.
Figure 8: European countries and Japan’s introduction of renewable power and its target | Source: Data of Eurostat, Agora Energiewende etc.