ISEP has analyzed the regional renewable energy usage based on the data of electricity supply and consumption for each TSO area, which is reported by 10 TSO/DSOs (Transmission and Distribution System Operators) in Japan.
Overview
- Renewable energy supply ratio can reach more than 100% of the consumption in Shikoku area (from 10 a.m. to 12 p.m. on May 20th, 2018). And the daily supply of renewable energy also reached around 52% of the consumption, 24% out of Solar PV as shown in Figure 1.
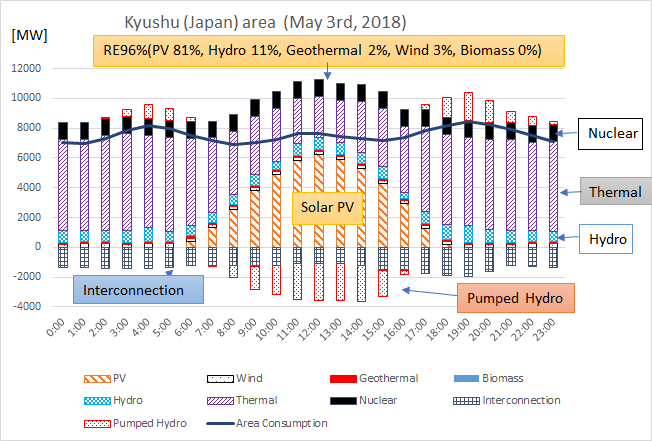
- As for Kyushu area, the solar electricity reached 81% of the consumption at the noon on May 3rd, 2018, and the renewable energy ratio reached 96% of the consumption as shown in Figure 2.
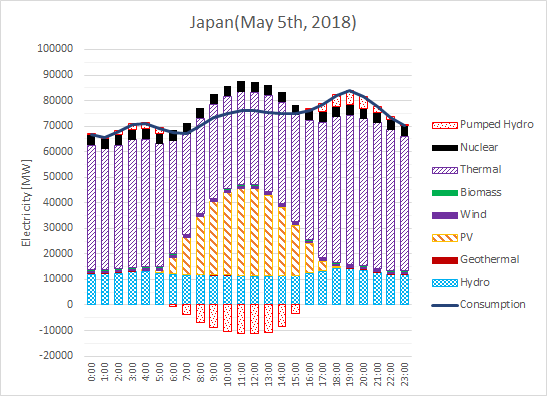
- As for all area of Japan, Renewable energy supply ratio reached 62% of the consumption during two hours at noon on May 5, 2018. So, the solar electricity ratio reached 45% as shown in Figure 3.
Figure 1. Daily electricity supply to the grid and the consumption in the Shikoku area (May 20, 2018)
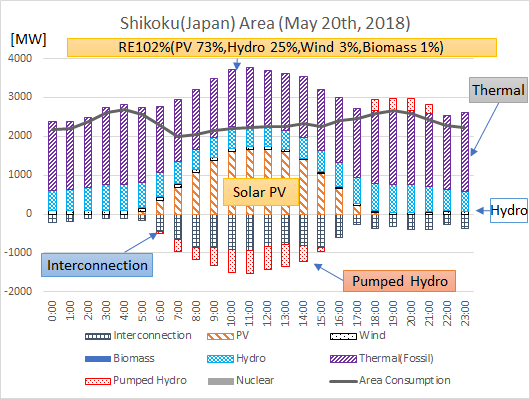
Source: Electricity supply and demand results published by Shikoku Electric Power Company, graph generated by ISEP
Figure 2. Daily electricity supply and consumption in the Kyushu area (May 3rd, 2018)
Source: Electricity supply and demand results published by Shikoku Electric Power Company, graph generated by ISEP
Figure 3. Daily electricity supply and consumption in Japan (May 5th, 2018)
Source: Electric power supply and demand results published by TSOs in Japan, graph generated by ISEP
Analysis
The electricity supply and consumption data (hourly data by resource) for each TSO/DSO area have been publicly disclosed since April 2016 from the TSO/DSO[1]. we have analyzed the electricity data during Q2 of 2018 (April 1st– June 30th) focusing the ratio of renewable energy in the area and the period of the data.
As shown in Figure.1 and Table.1, especially on the hour of May 20th, 2018 (Sunday) in Shikoku area, the maximum ratio of renewable energy reached 101.8% (PV 72.9%, Hydro 25.3%, Wind 3.2%, Biomass 0.5 %). Renewable energy exceeded 100% of the consumption for the first time in Japan during 2 hours from 10 a.m. to 12 p.m. on the day. The ratio of VRE (Variable Renewable Energy) such as solar and wind also reaches 76% of the consumption at the same time. At this period, Based on the priority dispatch rule by OCCTO, the Shikoku Electric Power mainly should manage thermal power generation (mainly fossil fuel) for flexibility of the system at first. However, interconnection to neighbor area (Chugoku and Kansai area) was mainly used for balancing and also pumped hydro was used as electricity storage for flexibility in this area.
Even for an average of one day on May 20th, the ratio of renewable energy has reached 52% of the consumption. In the Shikoku Area, 2230 MW capacity of Solar PV are operating as of the end of March 2018, and the power generation of PV reached 1730 MW at the peak.
As shown in Figure 2 and Table 1, for Kyushu Area, the ratio of renewable energy reached 96% of the electricity consumption on May 3, 2018 during one hour around 12 pm, in which PV solar reached 81% as shown in Figure 2. In the area, 7900MW capacity of PV Solar already been operating by end of March 2018, the VRE ratio has reached 84% at the period, and the VRE ratio is higher than that of Shikoku area.
Balancing of electricity supply and consumption are made by adjusting power output of thermal power generation (mainly fossil fuel) and pumped hydro as storage, and the interconnection between Kyushu and Chugoku area looks not used for adjustment. As a result, flexible adjustment for the VRE has been carried out despite of difficulties of adjusting of nuclear power supply and not using interconnection. If interconnection utilization would increase and nuclear power plants would stop, it is possible to avoid curtailment of existing VRE such as PV and wind or connect more PV and Wind without curtailment.
As shown in Figure 3 and Table 2, on May 5th, 2018 during one hour around 12 pm, the ratio of renewable energy reached 62% of the consumption of electricity in all area of Japan excluding Okinawa and other small island.
Table 1. The ratio of renewable energy in electricity supply and consumption in Shikoku and Kyushu area (Q2 of 2018, April 1st– June 30th)
| Shikoku Area | Kyushu Area | |||||
| Renewable Energy | Average | Daily Max. | Hourly Max. | Average | Daily Max. | Hourly Max. |
| Q2 | May 20th | May 20th
10:00-12:00 |
Q2 | May 3rd | May 3rd 11:00-12:00 |
|
| Solar PV | 13.2% | 23.9% | 72.9% | 14.4% | 24.9% | 81.3% |
| Wind | 1.6% | 2.6% | 3.2% | 0.7% | 2.8% | 2.5% |
| Biomass | 0.4% | 0.4% | 0.5% | 0.3% | 0.3% | 0.3% |
| Geothermal | 0.0% | 0.0% | 0.0% | 1.3% | 1.5% | 1.5% |
| Hydro | 16.9% | 25.2% | 25.3% | 7.4% | 10.0% | 10.5% |
| RE Ratio | 32.1% | 52.2% | 101.8% | 24.1% | 39.5% | 96.1% |
| VRE Ratio | 14.8% | 26.5% | 76.0% | 15.1% | 27.7% | 83.8% |
* RE: Renewable Energy; VRE: Variable Renewable Energy
Source: Data published by each utility, table generated by ISEP
Table 2. The ratio of renewable energy in electricity supply and consumption in Japan (Q2 of 2018, April 1st– June 30th)
| Renewable Energy | Average | Daily Max. | Hourly Max. |
| Q2 of FY2018 | May 5th | May 5th 12:00-13:00 | |
| Solar PV | 8.4% | 15.1% | 44.6% |
| Wind | 0.8% | 1.4% | 1.7% |
| Biomass | 0.6% | 0.6% | 0.5% |
| Geothermal | 0.2% | 0.3% | 0.3% |
| Hydro | 12.1% | 16.7% | 14.9% |
| RE Ratio | 22.1% | 34.1% | 62.0% |
| VRE Ratio | 9.2% | 16.5% | 46.3% |
Source: Data published by each utility, table generated by ISEP
Finally, ISEP has released the “ISEP Energy Chart” visualization web site for electricity supply and consumption based on the data set published quarterly from each TSO (large electric power company)[2] . You can check out various graphs and numerical data of electricity supply and consumption that are obtained as open data starting from April 2016.
Reference
[1] Organization for Cross-regional Coordination of Transmission Operators, JAPAN (OCCTO) Information Disclosure “Electricity supply and consumption related information” https://www.occto.or.jp/keitoujouhou/index.html
[2] ISEP “ISEP Energy Chart” https://www.isep.or.jp/chart/