2025 Share of Electricity from Renewable Energy Resources in Japan[Preliminary Report]
Institute for Sustainable Energy Policies (ISEP)
Sep. 1, 2026
Summary
In 2025, the estimated share of renewable energy in Japan’s total electricity generation including self-consumption was 26.1% in preliminary figure, a slight increase of less than 1 percentage point from 25.3% in the previous year, highlighting the need for policies to further expand renewable energy.
The annual share of solar power generation in 2025 was 9.9%, a slight increase from 9.7% in the previous year, bringing the total share of variable renewable energy (VRE: solar and wind) to 11.4%.
The share of biomass power generation increased by nearly 1 percentage point from 6.0% in the previous year to 6.9%. Wind power increased from 1.2% to 1.4%, but geothermal power decreased from 0.34% to 0.30%. Hydroelectric power also decreased from 8.1% in the previous year to 7.5%.
The annual share of fossil fuel-based thermal power generation was 64.5%, a further decrease from 66.1% in the previous year. LNG accounted for 28.9%, down 1 percentage point from 29.9%, and coal remained flat at 28.4%. Nuclear power accounted for 9.4%, an increase of nearly 1 percentage point from 8.6% in the previous year.
In Europe, many countries saw the annual share of renewable energy generation exceed 50% in 2025, with the average across the 27 EU countries reaching 47.7%. The combined share of solar and wind (VRE) reached 30% of total electricity for the first time, surpassing fossil fuels (29%). The share of solar power across the EU exceeded a record high of 13%, and five countries, including Hungary, met over 20% of their electricity demand with solar power.
The introduction of stationary storage batteries is progressing alongside solar power generation in various countries. Battery deployment is particularly advanced in China, the US, and EU countries like Germany and Italy. In Japan, over 10 GWh of battery capacity has already been installed, mainly on the demand side especially residential, and global capacity now rivals that of pumped-storage hydroelectricity.
In China, the introduction of wind and solar power has progressed rapidly alongside hydroelectric power over the past decade. In 2025, the annual share of wind power was 10.7% and solar power was 11.1%, which is more than double that of nuclear power (4.6%), bringing the total renewable energy share to 37% including 13% hydro.
According to Japan’s electricity supply and demand data for 2025, the average share of renewable energy against electricity demand was 24.1%. In seven areas excluding Tokyo, Kansai, and Okinawa, there were hourly share values when the renewable energy share exceeded 100%. The curtailment rate of VRE was relatively high in areas with operating nuclear power plants, such as Tohoku (2.9%), Kansai (2.2%), Shikoku (3.6%), Chugoku (1.6%), and Kyushu (4.1%), and lower in areas without operating nuclear plants, such as Hokkaido (0.16%), Hokuriku (0.04%), Chubu (0.26%), and Okinawa (0.15%). However, the national average curtailment rate increased from 1.4% in the previous year to 1.6%.
Share of Renewable Energy in Domestic Electricity Generation
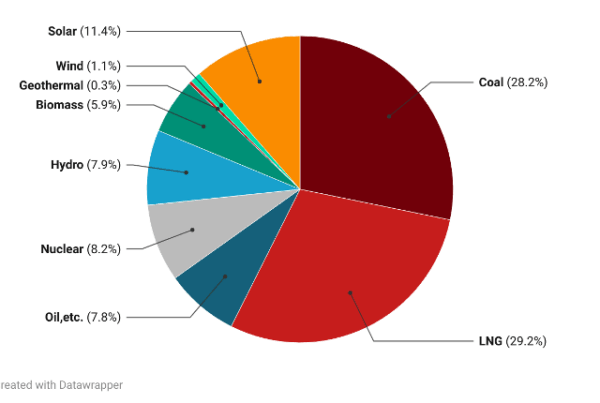
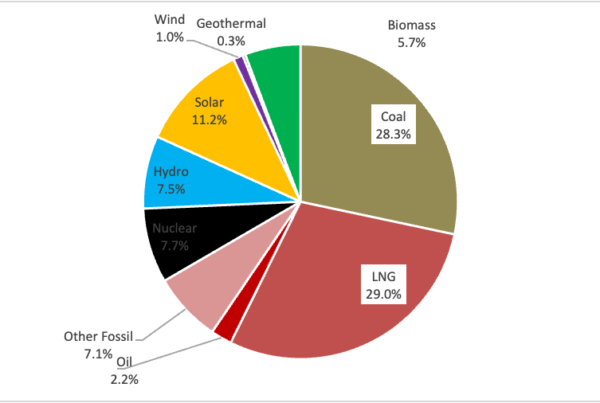
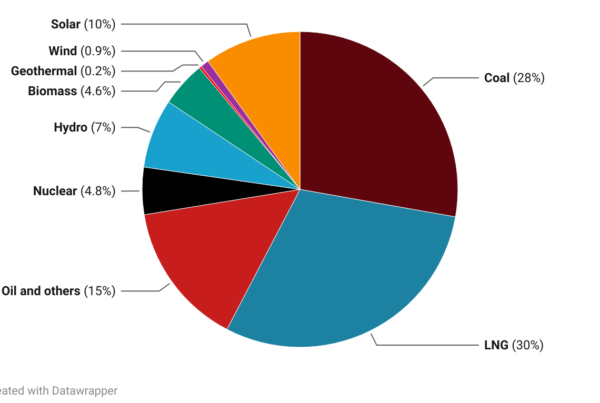
The share of each power source in Japan’s total electricity generation including self-consumption in 2025 was estimated based on electricity survey statistics and nationwide electricity supply and demand data. As a result, the share of renewable energy in total electricity generation in 2025 was 26.1% in Table 1 and Figure 1.
The share of renewable energy, which was about 14% in 2016, increased by at least 1 percentage point annually to reach 21% by 2021, and in 2025 it increased by 1 point from 25.3% in the previous year to reach 26.1% in Figure 2. Among these, solar power generation reached 9.9%, a slight increase from 9.7% in the previous year, gradually approaching the 15% target for the 2030 energy mix outlined in the Basic Energy Plan. Combined with the 1.4% share of wind power, the VRE share was 11.4%, a slight increase from 10.8% in 2024. For renewable energies other than solar, biomass power accounted for 6.9%, up from 6.0% in the previous year. Wind power also increased from 1.2% to 1.4%. Meanwhile, geothermal power slightly decreased to 0.30%. Hydropower also decreased from 8.1% to 7.5%. Looking at monthly data, the share of renewable energy was highest in May 2025, reaching 35.5% in Figure 3. In April 2025, the solar share peaked at 13.1%, and the VRE share reached 14.6%.
For wind and solar power generation data, rather than using electricity survey statistics (electricity transmitted and received by electric utilities), transmission data from electricity supply and demand data published by power companies was used. Previously, electricity survey statistics were used for solar power data, but it was necessary to note a margin of error because the annual transmission volume is about 10% larger when compared to electricity supply and demand data. The estimated electricity generation from the electricity survey statistics is the sum of generation reported by electric utilities (retailers and generators above a certain size) and electricity received from non-utility generators, which could be inflated due to double counting. Therefore, the solar power generation data has been retrospectively re-estimated.
Thermal power generation is on a downward trend, accounting for 64.5% in 2025, down from 66.1% in the previous year; although this is a decrease of nearly 20 percentage points since 2016, it remains at a high level. Coal-fired thermal power decreased from 31% in 2016 to 28.4% in 2025. LNG has almost consistently declined by more than 10 percentage points from 39.1% in 2016 to 28.9%. On the other hand, nuclear power, which dropped to zero in 2014, increased to 6.5% by 2019, decreased to 4.9% in 2022, but rose to 9.4% in 2025.
Table 1: Trends in the share of renewable energy in Japan’s total electricity generation
Source: Prepared by ISEP from electricity survey statistics, etc.
Figure 1: Power source mix for the entirety of Japan (2025 preliminary)
Source: Prepared by ISEP from electricity survey statistics, etc.
Figure 2: Trend in the share of renewable energy in Japan’s total electricity generation
Source: Prepared by ISEP from electricity survey statistics, etc.
Figure 3: Monthly share of renewable energy in Japan’s total electricity generation (2025 preliminary)
Source: Prepared by ISEP from electricity survey statistics, etc.
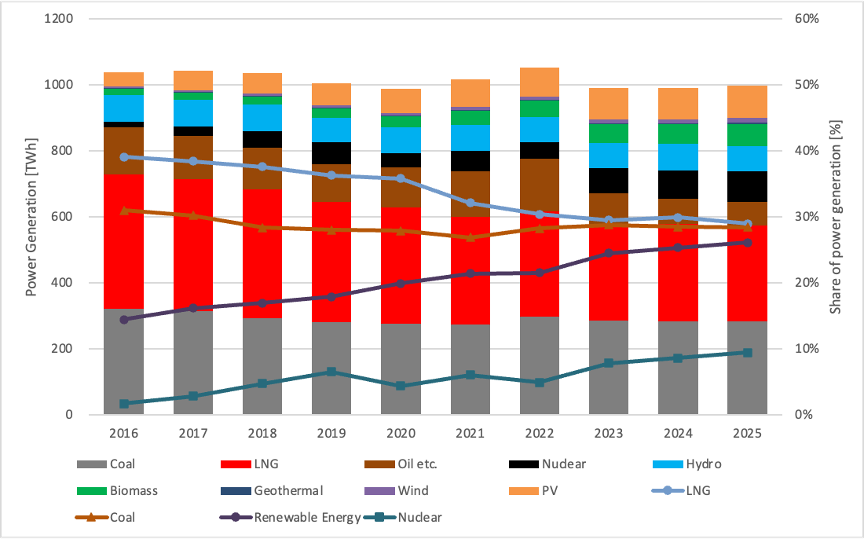
Figure 4: Trend of annual electricity generation and power source mix in Japan
Source: Prepared by ISEP from electricity survey statistics, etc.
Comparison of Renewable Energy Share with Other Countries
Since the 1990s, the EU has led the world in the introduction of renewable energy. The renewable energy electricity share of all 27 EU countries reached 47.7% in 2025, marking a milestone as the combined share of solar and wind (VRE) reached 30% of EU electricity for the first time, overtaking fossil fuels (29%). The share of solar power across the EU exceeded a record high of 13% in 2025, and five countries (Hungary, Cyprus, Greece, Spain, and the Netherlands) supply over 20% of their electricity from solar. In June 2025, solar power became the largest single power source across the EU on a single-month basis for the first time, while coal-fired power dropped to 9.2% (a significant decrease from 24.6% ten years ago). Figure 5 shows the share of renewable energy electricity in major countries. In Denmark, which covers over 57% of its electricity with wind, the share of renewable energy in annual electricity generation reached 92% (VRE is 71%). Austria reached 83% mainly due to 51% hydropower, and Portugal reached 81% due to a rapid expansion of solar. Sweden (71%), Germany (59%), Spain (56%), and the UK (52%) all exceeded the European average (48%), whereas France, with its high nuclear ratio, remained at a 26% renewable share. In China, which has the world’s largest renewable power capacity, the share exceeded 36%, with balanced increases in solar (10.2%), wind (10.9%), and hydro (13.1%).
Looking at the trends in renewable energy electricity shares in European countries and Japan from the 1990s to 2025, it is clear that European countries have seen steady and rapid increases since the 2010s (Figure 6). Denmark was at 17% in 2000, exceeded 30% in the 2010s, reached 78% in 2020, and 92% in 2025, aiming for over 100% renewable electricity (including exports) by 2030. The EU as a whole more than doubled from 21% in 2010 to 48% in 2025, accelerating its deployment toward the 69% target for 2030 based on REPowerEU. Looking at national policy targets, Austria aims for 100% by 2030 (climate neutral by 2040), Spain 81%, Germany 80% (climate neutral by 2045 = effectively 100%), and the UK 80% (100% clean power by 2030), all of which are high levels. China, after a decline from 20% (mostly hydro) in 1990, has seen a sharp rise since 2015 due to the rapid expansion of wind and solar, reaching 37% in 2025. Under China’s Five-Year Plan, a Renewable Portfolio Standard (RPS) of around 40% for 2030 is proposed, and its 2035 NDC anticipates a power share of 50% or more. Meanwhile, the US saw a gradual increase from 12% in 1990 to 26% in 2025, but the ‘100% clean electricity by 2035’ target under the Biden administration was withdrawn under the Trump administration, leaving no federal-level power sector target (though state-level targets like California’s remain).
Towards the target of ‘tripling global renewable energy capacity to 11 TW by 2030’ agreed upon at COP28 in 2023, the global renewable energy market continues to expand at an unprecedented pace. In 2025, the global newly installed capacity of renewable energy broke the previous year’s record, reaching a historical high. Combining the latest data from the IEA and Ember, the annual newly installed capacity in 2025 is estimated to have reached approximately 800 GW (Figure 7). This represents a growth of over 10% from the 2024 installations (approx. 700 GW) and signifies another step closer to the pace of ‘over 1000 GW (1 TW) per year’ required to achieve the 2030 target. Solar power, in particular, is the biggest driver of this growth, accounting for about 80% of newly installed global capacity. Due to this massive deployment, cumulative global solar capacity increased significantly from about 2.2 TW at the end of 2024 to nearly 3 TW by the end of 2025. Just over three years after crossing the 1 TW mark in 2022, the scale has expanded roughly threefold.
Meanwhile, the introduction of stationary storage batteries is progressing globally, including demand-side batteries installed alongside solar systems and grid-scale batteries to improve grid flexibility. At COP29 held in Azerbaijan in November 2024, over 60 countries, including Japan, endorsed a pledge to increase battery capacity sixfold by 2030. The adoption of storage batteries is most advanced in China, which ranks first globally in solar and wind deployment, followed by the EU and the US (Figure 8). Within the EU, Germany and Italy, which have large solar capacities, also have significant battery deployment, and Japan’s domestic deployment is at a similar level. In Japan, over 10 GWh of stationary storage capacity has been installed, equivalent to about one-tenth of the country’s pumped-storage capacity. Globally, the installed capacity of batteries is surpassing that of pumped hydro, which has traditionally provided flexibility for power systems.
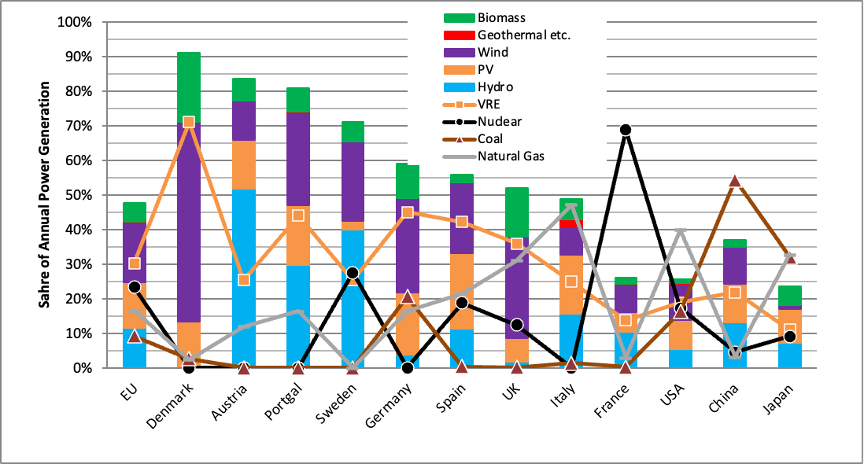 Figure 5: Comparison of the share of renewable energy etc. in electricity generation between European countries, the US, China, and Japan (2025)
Source: Prepared by ISEP from Ember data
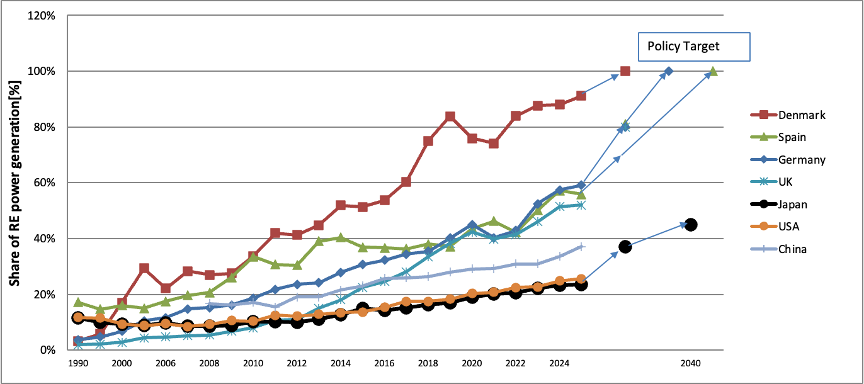 Figure 6: Actual installation and policy targets for renewable energy electricity in European countries and Japan
Source: Prepared by ISEP from Eurostat, Ember data, etc.
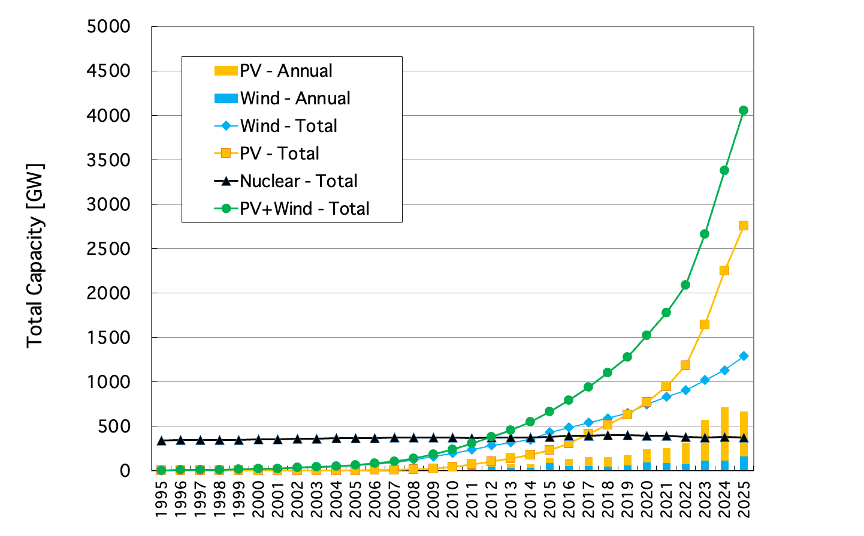 Figure 7: Trend of global installed capacity for solar power, wind power, and nuclear power.
Source: Prepared from data by IRENA, IAEA, etc.
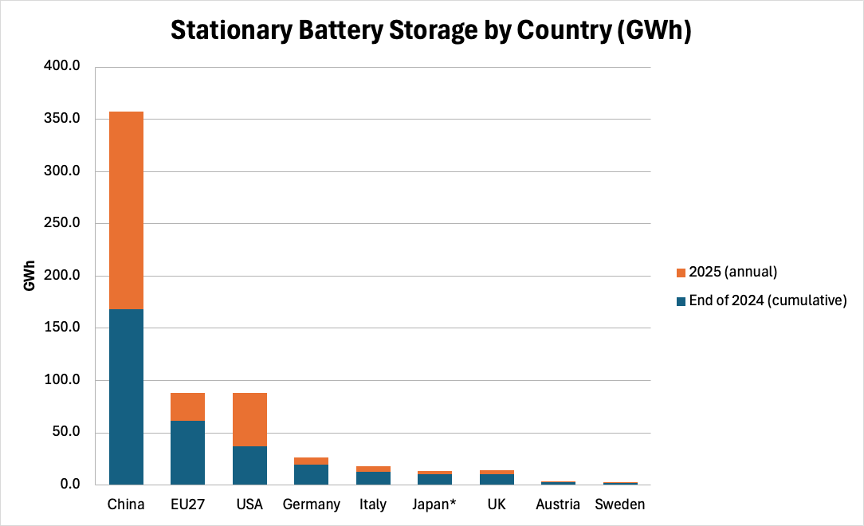 Figure 8: Cumulative installed capacity of stationary storage batteries worldwide (end of 2025).
Source: Prepared from CNESA Datalink, SolarPower Europe, METI materials, etc.
Share of Renewable Energy in Japan’s Electricity Supply and Demand
Based on electricity supply and demand data published monthly by 10 general transmission and distribution companies for each region across Japan, data for the full calendar year of 2025 was compiled, focusing on the share of renewable energy relative to grid electricity demand. The average share of renewable energy relative to Japan’s total annual electricity demand was 24.1% in 2025 (calendar year), an increase from the 2024 annual average of 23.2% (Figure 9). Breaking this down, the share of solar power was 10.9%, and combined with the 1.6% share of wind power, the VRE share was 12.5%. Solar slightly increased from 10.6% in 2024, representing a larger share than hydropower at 7.9%. Biomass generation increased from 2.8% to 3.4%. On the other hand, the share of nuclear power in 2024 was 10.5%, an increase from 9.8% in the previous year.
Looking at the monthly average share of renewable energy in Japan’s overall electricity demand, May 2025 was the highest at 33.8%, an increase from 32.2% in the previous year. The VRE share was highest in April at 16.3%, consisting of 14.6% for solar and 1.8% for wind. On a daily average basis, it reached 44.6% on May 3, 2025, and the VRE share also peaked on the same day at 24.8%. In terms of hourly values, the renewable energy share peaked at 82.8% during the 10:00 AM hour on May 3, the highest of the year; during the 11:00 AM hour, solar reached 64.2%, and combined with 1.6% for wind, the VRE peak was 65.7%. Incidentally, the peak value for wind power alone was 6.9% in the early hours of March 29, 2025.
By power company (general transmission and distribution operator) area, the Tohoku area had the highest average share of renewable energy against annual electricity demand in 2025 (calendar year) at 44.7% (Figure 10). Solar was 13.9% and wind was 6.6%, resulting in a VRE share of 20.5%; additionally, its biomass share of 7.8% was second only to Shikoku, its geothermal share of 1.5% was the highest in the country, and hydropower also accounted for a significant 14.9%. The Hokkaido area ranked second with a renewable energy share of 44.2%, but its wind power share of 10.4% was the highest nationally, bringing its VRE share to a nationwide high of 21.3%. On average across eastern Japan in 2025, the renewable energy share was 23.0%, below the national average of 24.1%. This is largely due to the Tokyo area remaining at 14.6%. Conversely, the VRE share in eastern Japan was 12.7%, exceeding the national average of 12.5%. This is because the wind power share was 2.4%, surpassing the national average of 1.6%.
In 2025, the overall renewable energy share for central and western Japan was 25.0%, exceeding the national average of 24.1%, but the VRE share (combined solar at 11.3% and wind at 1.0%) was 12.3%. Meanwhile, nuclear power, which barely operates in eastern Japan (1.7%), operates in the Kansai, Chugoku, Kyushu, and Shikoku areas of central and western Japan, representing a 17.7% share that significantly exceeds VRE and remains flat from the previous year. In the Hokuriku Electric Power area, which has the third-highest renewable energy share, the figure reached 37.7% in 2025, but its VRE share was relatively low at 7.0% (solar 6.3%, wind 0.6%), while its hydropower share of 28.0% was the highest in the country. In the Shikoku area, which ranked fourth, the renewable energy share was 35.9%, up from 35.0% in 2024, but the nuclear power share also increased from 21.9% in the previous year to 23.3%. In the Shikoku area, solar was 15.8% (second only to Chugoku at 16.2%), and the combined VRE share with wind (2.2%) was 18.0%, a high level nationally, trailing only Hokkaido (20.3%), Tohoku (19.3%), and Kyushu (18.5%). In the Kyushu area, the renewable energy share was 33.6% and the VRE share was 18.5%. Of this, solar was 15.6%, down from 16.2% in the previous year, and wind was 2.8%. However, the nuclear power share reached 26.3%, marking a high level alongside Kansai Electric Power (34.6%).
In 2025, there were seven areas where renewable energy exceeded 100% of electricity demand on an hourly basis: Hokkaido, Tohoku, Chubu, Hokuriku, Shikoku, Chugoku, and Kyushu. Among these, in the Hokuriku area, the ratio of renewable energy to electricity demand reached 128% during the 9:00 AM hour on May 3, 2025, but at its peak, hydropower accounted for 77% and solar for 48%. In the Chugoku area, the renewable energy share reached a maximum of 125%, with the VRE share hitting 115% (solar 114.2%, wind 0.9%). In the Kyushu area, which has the highest curtailment rate, the hourly solar share peaked at a maximum of 107%. The VRE share was also limited to a maximum of about 78%. Before curtailment, the potential VRE share in the Kyushu area reached up to 146%, meaning VRE curtailment reduced the share to 70% (a 52% curtailment rate at peak).
In the Kyushu area, curtailment of VRE (solar and wind) has been implemented among national areas since 2018; for the full year of 2025, the VRE curtailment rate was 4.1%, down from 4.4% in 2024. The Kyushu area has about 4 GW of nuclear power capacity, and in 2025, the share of nuclear electricity was 26.3%, down from 34.5% in the previous year. By around April 2023, VRE curtailment had begun in all other areas except Tokyo (where it also began in May 2026). Besides Kyushu, VRE curtailment rates were relatively high in other areas with operational nuclear plants: Shikoku (3.6%), Tohoku (2.9%), Kansai (2.2%), and Chugoku (1.6%). In areas without operational nuclear plants, rates were kept low: Hokkaido (0.16%), Hokuriku (0.04%), Chubu (0.26%), and Okinawa (0.15%). The national average curtailment rate was 1.6%, up from 1.5% in the previous year. Notably, on April 27, 2025, 16.5 GW of renewable energy (solar + wind) was simultaneously curtailed across Japan. Upon analyzing whether this curtailment was physically/structurally inevitable or the result of systemic choices such as operation, contracts, and planning rigidities, it is estimated that 6 GW of this could have been avoided simply by changing operations without requiring facility upgrades.
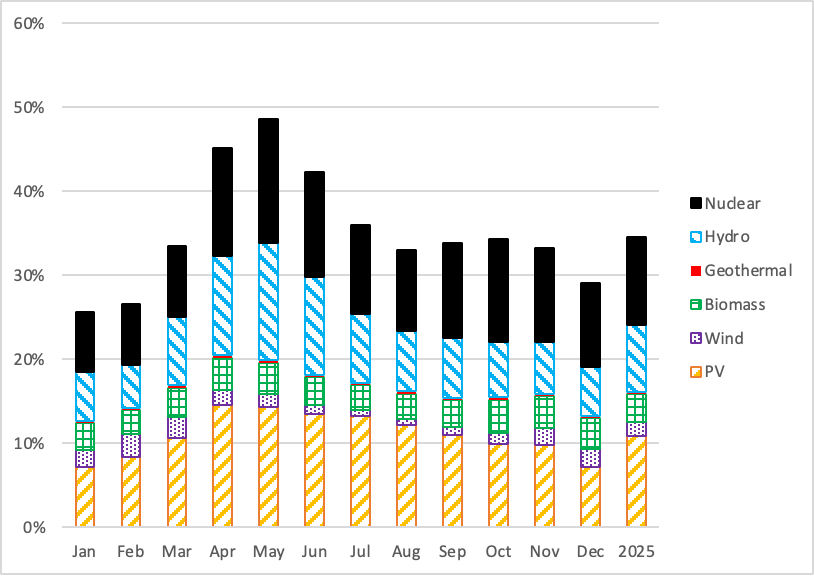 Figure 9: Monthly share of renewable energy and nuclear power in Japan’s electricity supply and demand (2025)
Source: Prepared from electricity supply and demand data of general transmission and distribution companies
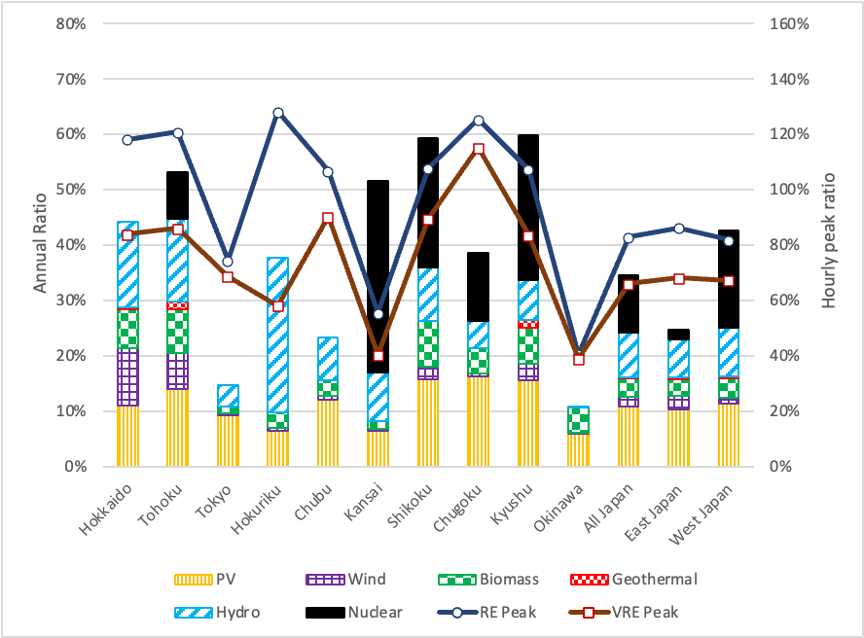 Figure 10: Share of renewable energy in electricity supply and demand by area (2025)
Source: Prepared from electricity supply and demand data of general transmission and distribution companies