2024 Share of Electricity from Renewable Energy Resources in Japan[Preliminary Report]
Institute for Sustainable Energy Policies (ISEP)
July 31, 2025
Abstract
- It is estimated that the share of renewable energy in Japan’s total electricity generation including self-consumption for the calendar year 2024 was 26.7% as preliminary value, an increase of 1 percentage point from the previous year’s 25.7%. However, policies for further expansion are required.
- The annual share of solar power generation in 2024 was 11.4%, a slight increase from 11.2% the previous year. The share of Variable Renewable Energy (VRE), which includes solar and wind, reached 12.6%.
- The share of biomass power generation was 5.9%, a slight increase from 5.7% the previous year. Wind power saw a minor increase to 1.13% from the previous year, and geothermal power also rose slightly to 0.33%. Hydropower increased by 0.4 percentage points from the previous year to 7.9%.
- The share of electricity generated by fossil fuels decreased to 65.1% the previous year. LNG remained nearly flat at 29.1%, as did coal at 28.2%. Nuclear power increased to 8.2% from 7.7% the previous year.
- In Europe, many countries exceeded a 50% share of renewable energy in their annual electricity generation in 2024, with the EU27 average reaching 47.5%. Due to factors like the Ukraine crisis, the share of fossil fuel generation has fallen to 29.1% (15.7% natural gas, 9.8% coal). The share of VRE is also high, led by Denmark at 69%, with countries like Portugal, Germany, and Spain exceeding 40%. The EU27 average for VRE is 28.6%.
- Alongside the adoption of solar power, the installation of stationary storage batteries is progressing in various countries. This is particularly advanced in China, the United States, and within the EU, Germany and Italy—countries with large-scale solar power deployment. In Japan, over 10 GWh have already been installed, mainly on the demand side especially for residential use, and globally, the installed capacity is comparable to that of pumped-storage hydropower.
Share of Renewable Energy in Power Generation
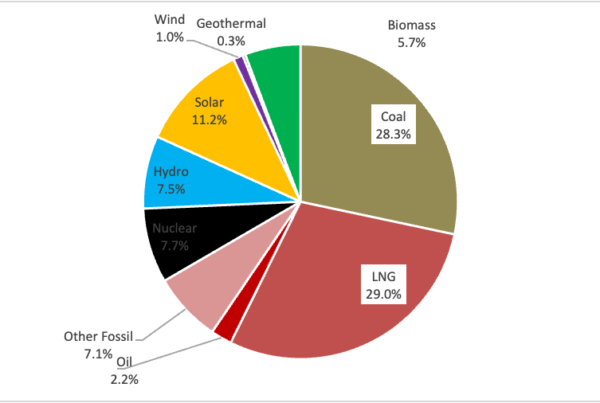
Based on Electricity Survey Statistics and national electricity supply and demand data, the power source mix for Japan’s total electricity generation in 2024 including self-consumption was estimated. The results show that the share of renewable energy was 26.7% for the calendar year 2024 as shown in Table 1 and Figure 1.
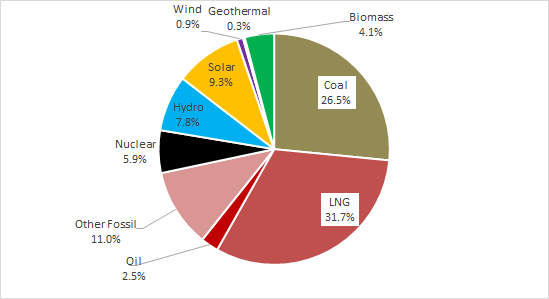
The share of renewable energy, which was about 15% in 2016, increased by more than 1 percentage point annually to reach 22% by 2021. In 2024, it rose by 1 percentage point from the previous year to 26.7% as shown in Figure 2. Within this, solar power generation reached 11.4%, a slight increase from 11.2% the previous year, gradually approaching the 15% target set for FY2030 in the Basic Energy Plan. Combined with wind power’s 1.13% share, the VRE (Variable Renewable Energy) share was 12.6%, a slight increase from 12.3% in 2023. Regarding other renewables, biomass power’s share was 5.9%, nearly unchanged from 5.7% the previous year. Wind power increased slightly to 1.13% from 1.07%, and geothermal also saw a small rise to 0.33%. Hydropower increased to 7.9% from 7.5% the previous year. On a monthly basis, the share of renewable energy generation was highest in May 2024, reaching 34.7% as shown in Figure 3. In that month, the share of solar power was high at 15.8%, and the VRE share reached 17.1%.
Regarding wind power generation data, this report uses the transmitted electricity volume from electricity supply and demand data published by power companies, rather than data from the Electricity Survey Statistics by METI. For solar power generation, data from the Electricity Survey Statistics is used. However, it should be noted that the annual transmitted electricity volume is about 10% larger in these statistics compared to the supply and demand data, which means there is a range in the estimated share of solar power. Specifically, the estimated annual solar power generation from the Electricity Survey Statistics was 114.6 TWh, whereas the transmitted volume from supply and demand data was 93.4 TWh. With an estimated 3.2 TWh from residential solar under 10 kW, the total becomes 96.6 TWh, which is over 10% smaller, resulting in a solar power share of 9.6%. The generation estimate from the Electricity Survey Statistics, which sums up reports from electric utilities and received power from other businesses, may be inflated due to factors like double-counting.
Electricity generation from fossil fuel is on a downward trend, falling to 65.1% in 2024 from 66.6% the previous year, a decrease of over 18 percentage points since 2016, though it remains at a high level. Coal-fired power decreased from 30.2% in 2016 to 28.2% in 2024. LNG has shown a consistent downward trend from 38.9% in 2016 to 29.1% in 2024. Meanwhile, nuclear power generation, after dropping to zero in 2014, increased to 6.5% in 2019, fell to 4.8% in 2022, and rose again to 8.2% in 2024.
Table 1: Trends in the Share of Renewable Energy in Japan’s Total Power Generation.
Source: ISEP, based on Power Survey Statistics, etc.
Figure 1: Japan’s Overall Power Source Mix in 2024 Preliminary
Source: ISEP, based on Power Survey Statistics, etc.
Figure 2: Trends in the Share of Renewable Energy in Japan’s Total Power Generation
Source: ISEP, based on Power Survey Statistics, etc.
Figure 3: 2024 Monthly Share of Renewable Energy in Japan’s Total Power Generation
Source: ISEP, based on Power Survey Statistics, etc.
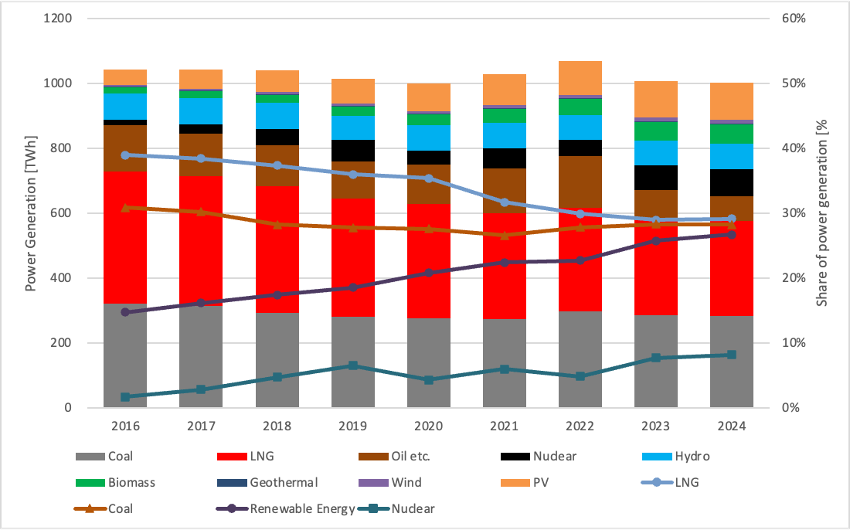
Figure 4: Trends in Japan’s Annual Power Generation and Power Source Mix
Source: ISEP, based on Power Survey Statistics, etc.
Comparison of Renewable Energy Share with Other Countries
In the adoption of renewable energy in the electricity sector, the EU has been a global leader since the 1990s. In 2024, the share of renewable energy in the EU27’s electricity generation reached 47.5%, significantly surpassing the 29.1% from fossil fuels. This is nearly twice Japan’s renewable energy share. The share of Variable Renewable Energy (VRE), such as solar and wind, reached 28.6% across Europe, more than double Japan’s approximately 12%.
Figure 5 shows a breakdown of the share of renewable energy in the annual electricity generation for 2024 in major European countries, the United States, China, and Japan. This figure is based on the latest 2024 data on the power sector from the UK think tank Ember. In Denmark, where the VRE share has already reached 69%, the total renewable energy share in annual electricity generation is 88%, with wind power alone accounting for 58%. In Austria, with hydropower at 57%, the total renewable share reaches 86.7% when combined with wind (12%) and solar (11%). Portugal has reached 85.2%, and Sweden 69.5%. Countries like Germany (57.4%), Spain (57.2%), and the UK (51.5%) have already surpassed a 50% renewable energy share, exceeding the European average. The VRE share has reached 28.6% for the EU as a whole, with Spain and Germany reaching 43%. In contrast, France, with a nuclear power share exceeding 68%, has a renewable energy share of only 26%.
Comparing the trends in the share of renewable energy in annual electricity generation from the 1990s to 2023 between European countries and Japan reveals that European nations have steadily increased their renewable energy share towards 2020 as shown in Figure 6. Denmark, which was already at 17% in 2000, exceeded 30% by 2010 and reached 87% in 2023, aiming for over 100% renewable electricity by 2030. Through two decades of experience since 2000, Denmark has implemented integrated solutions in its power system and market to accommodate over 50% of its electricity from VRE.
The UAE Consensus, agreed upon by countries including Japan at COP28 in December 2023, aims to triple the global renewable energy capacity by 2030 compared to 2022 and double the global average rate of energy efficiency improvements. The required renewable energy deployment to meet this 2030 goal, as indicated in scenarios by the IEA and IRENA, is to increase renewable capacity from 3.4 TW in 2022 to over 11 TW. This requires 1 TW (1000 GW) of new installations annually. In 2024, the world installed over 500 GW (0.5 TW) of renewable energy capacity, including 450 GW of solar and over 100 GW of wind.
Meanwhile, the installation of stationary storage batteries, both on the demand side with solar power and for grid flexibility, is advancing globally. At COP29 in Azerbaijan in November 2024, over 60 countries, including Japan, pledged to increase storage capacity sixfold by 2030. China, the world leader in solar and wind installation, is also leading in battery storage, followed by the EU and the US (Figure 9). Within the EU, Germany and Italy, which have large solar capacities, also have significant battery storage installations, comparable to Japan’s level. Japan has installed over 10 GWh of stationary storage capacity, equivalent to about one-tenth of its pumped-storage hydro capacity. Globally, the installed battery capacity is becoming comparable to that of pumped-storage hydro, which has historically provided flexibility to power systems.
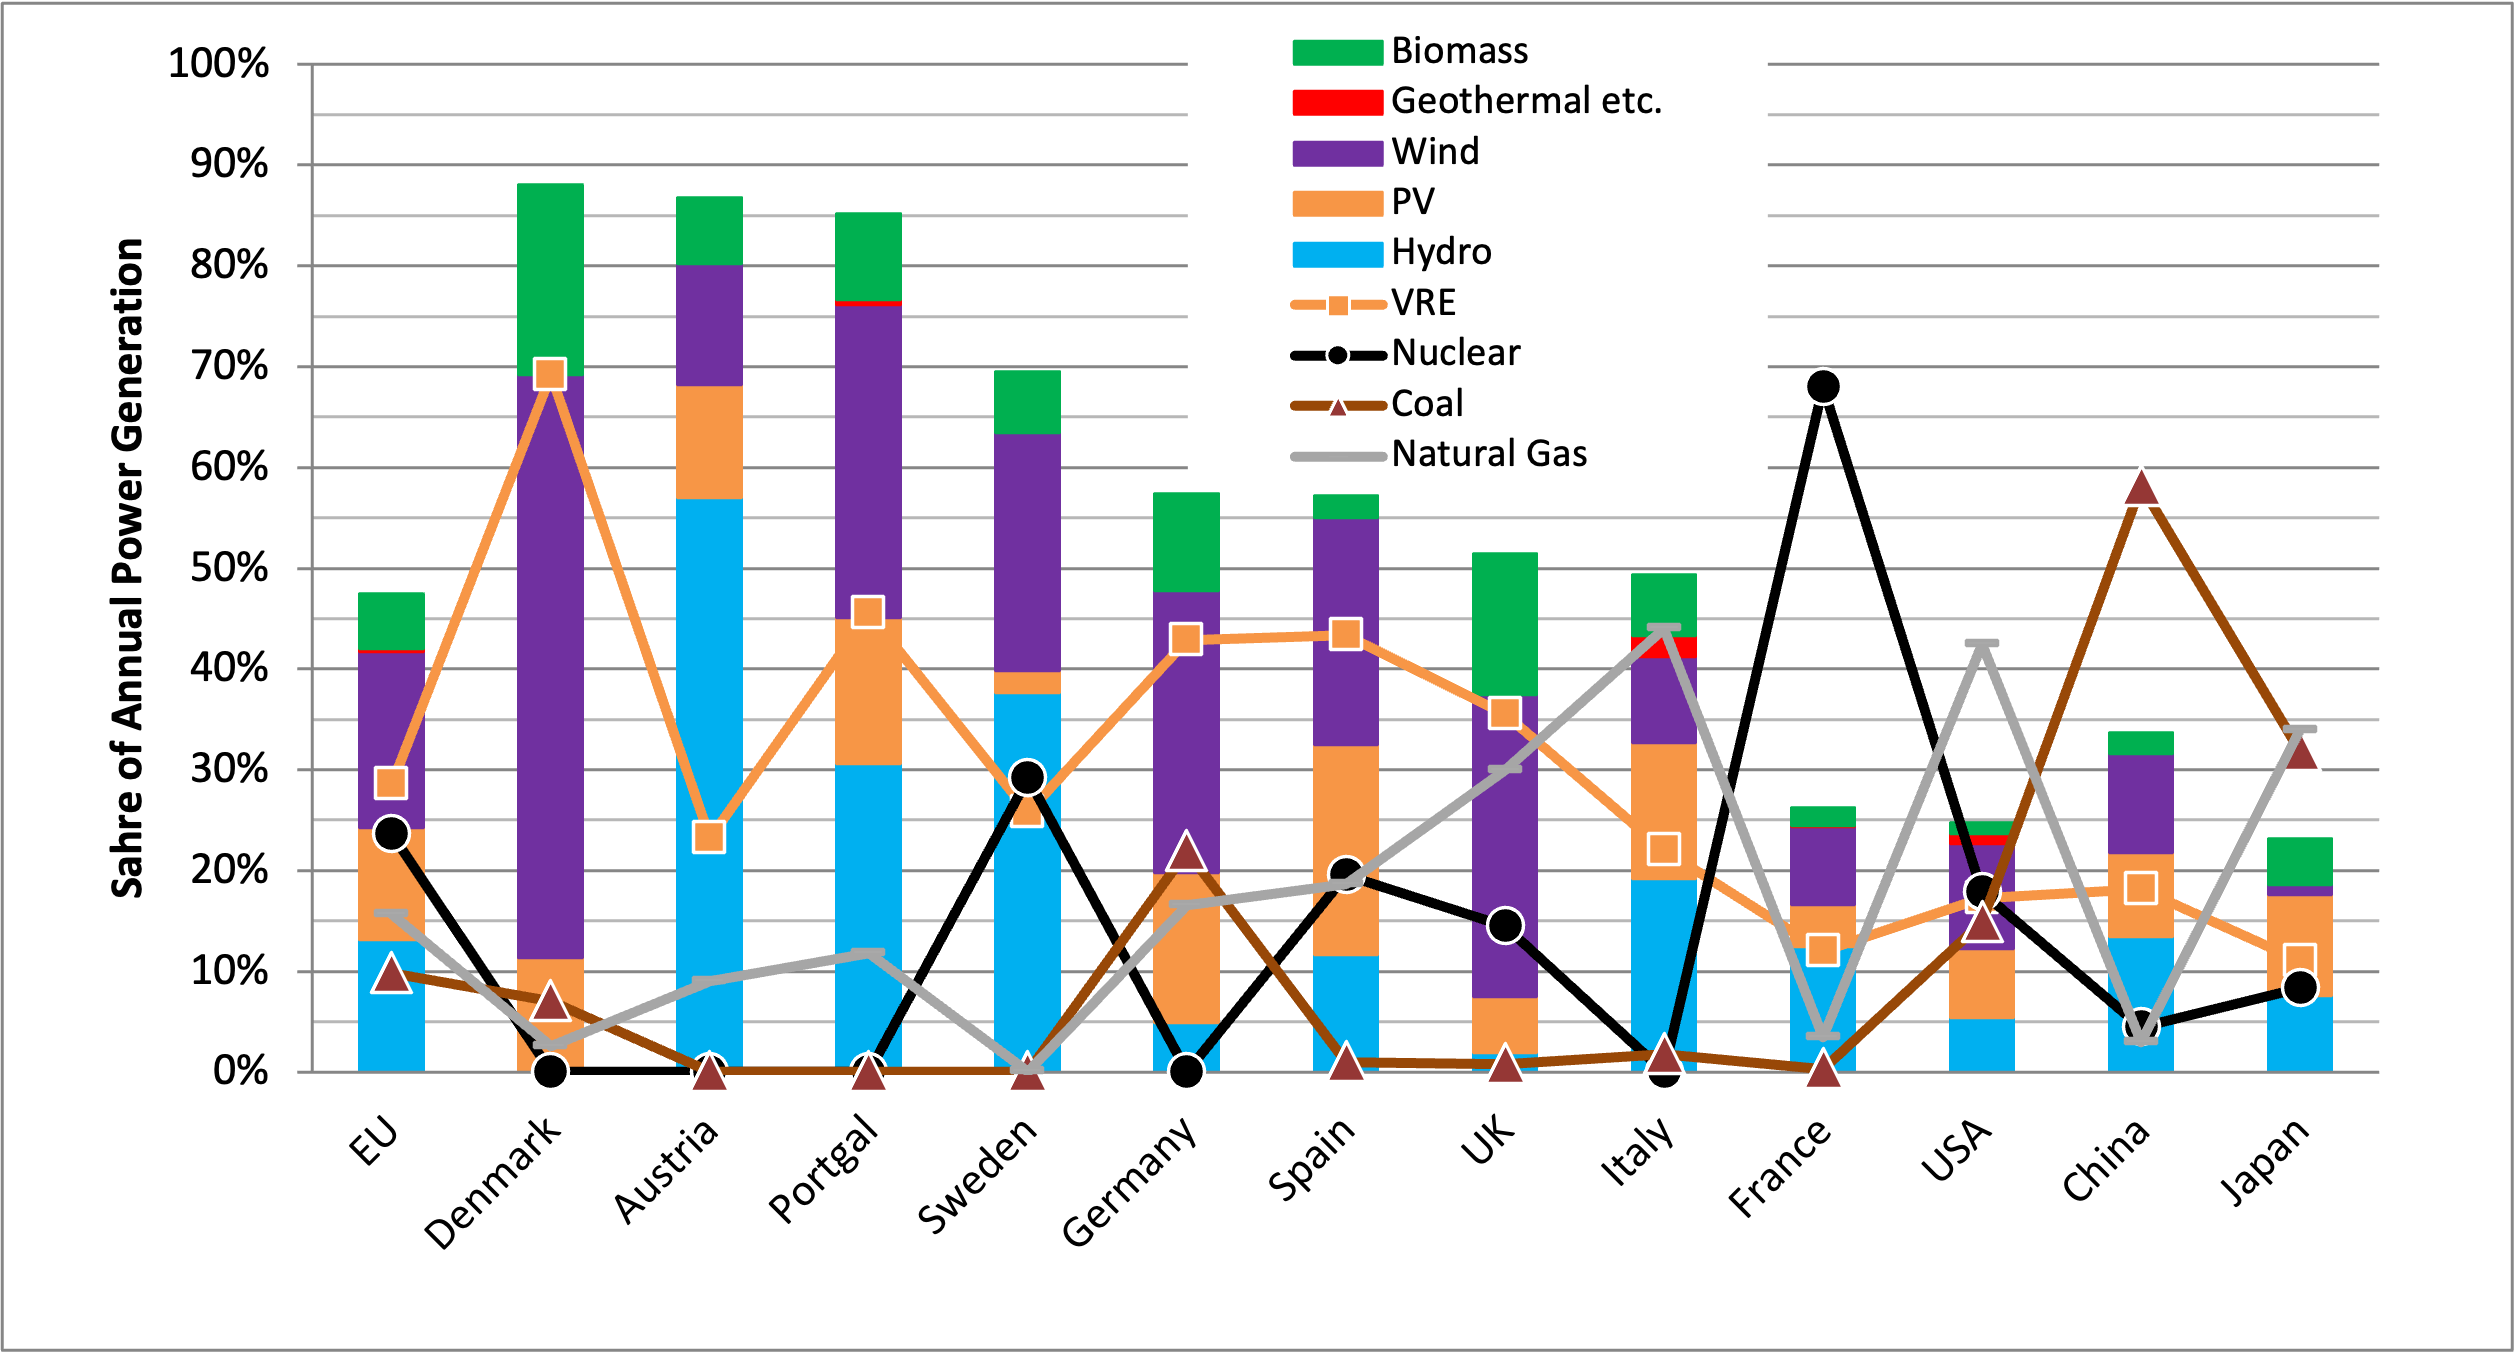 Figure 5: Comparison of the Share of Renewable Energy Power Generation in European Countries, USA, China, and Japan (2024) Source: ISEP, based on Ember data
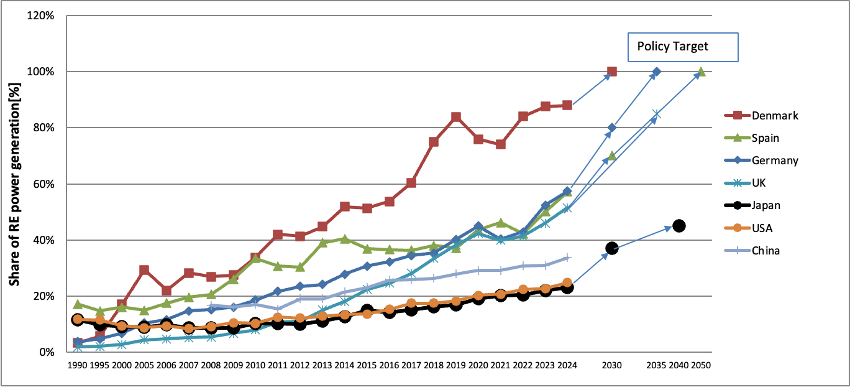 Figure 6: Renewable Electricity Adoption Performance and Policy Targets in European Countries, Japan, China and USA Source: ISEP, based on Eurostat, Ember data, etc.
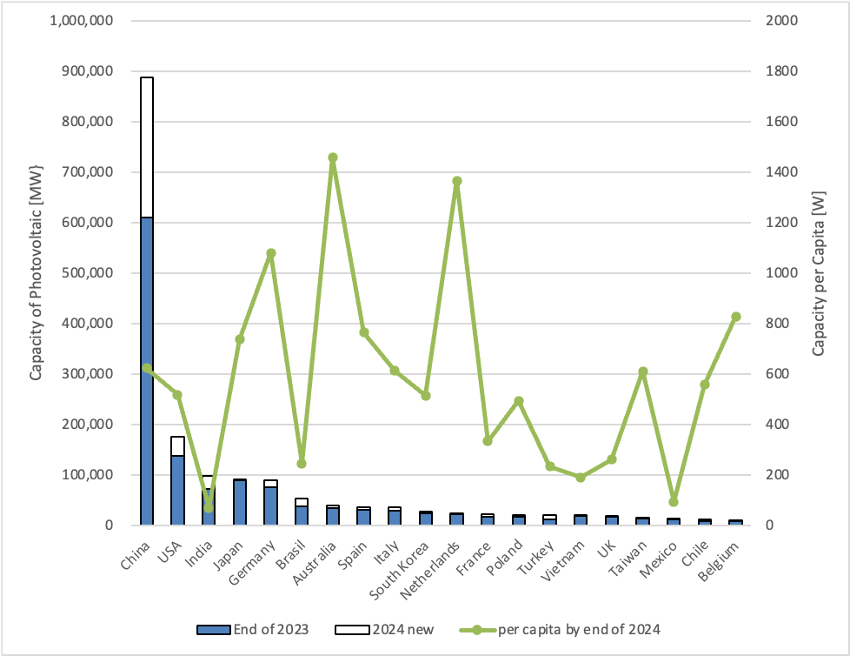 Figure 7: Global Solar PV Installed Capacity by end of 2024. Source: IRENA data
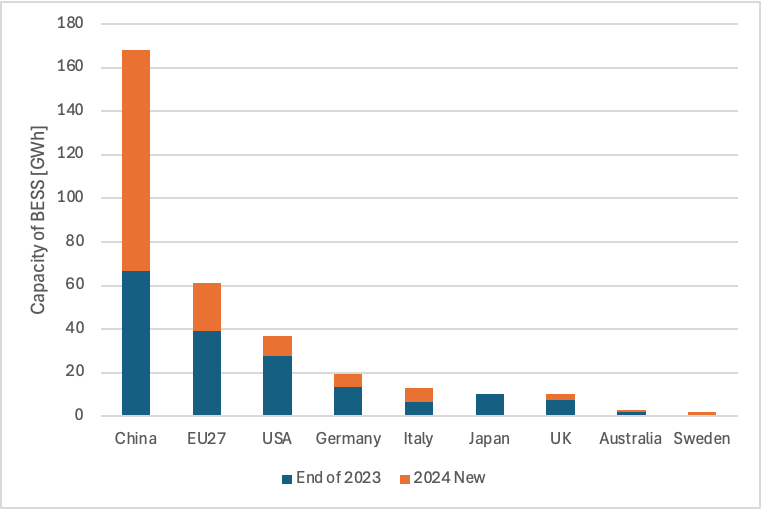 Figure 8: Cumulative Installed Capacity of Stationary Storage Batteries in Various Countries (End of 2024) Source: European Market Outlook for Battery Storage 2025-2029, METI documents, etc.